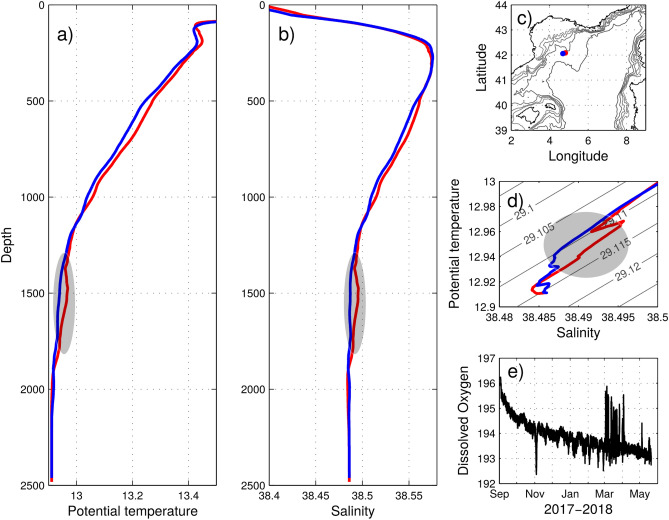
Figure 6.
(a) Potential temperature and (b) salinity depth profiles collected during the MOOSE-GE 2018 cruise in spring: (c) leg 1, stations 040 in blue (21/04/2018 19h15 UTC) and 041 in red (21/04/2018 21h52 UTC). (d) diagram for the two corresponding profiles. The newly formed deep waters detected on profile 041 in red are marked by the grey patch. They were detected down to 1800 m. (e) Dissolved oxygen ( mol kg) time series at 2000 m between 04/09/2017 and 22/05/2018 recorded at the LION mooring line.

