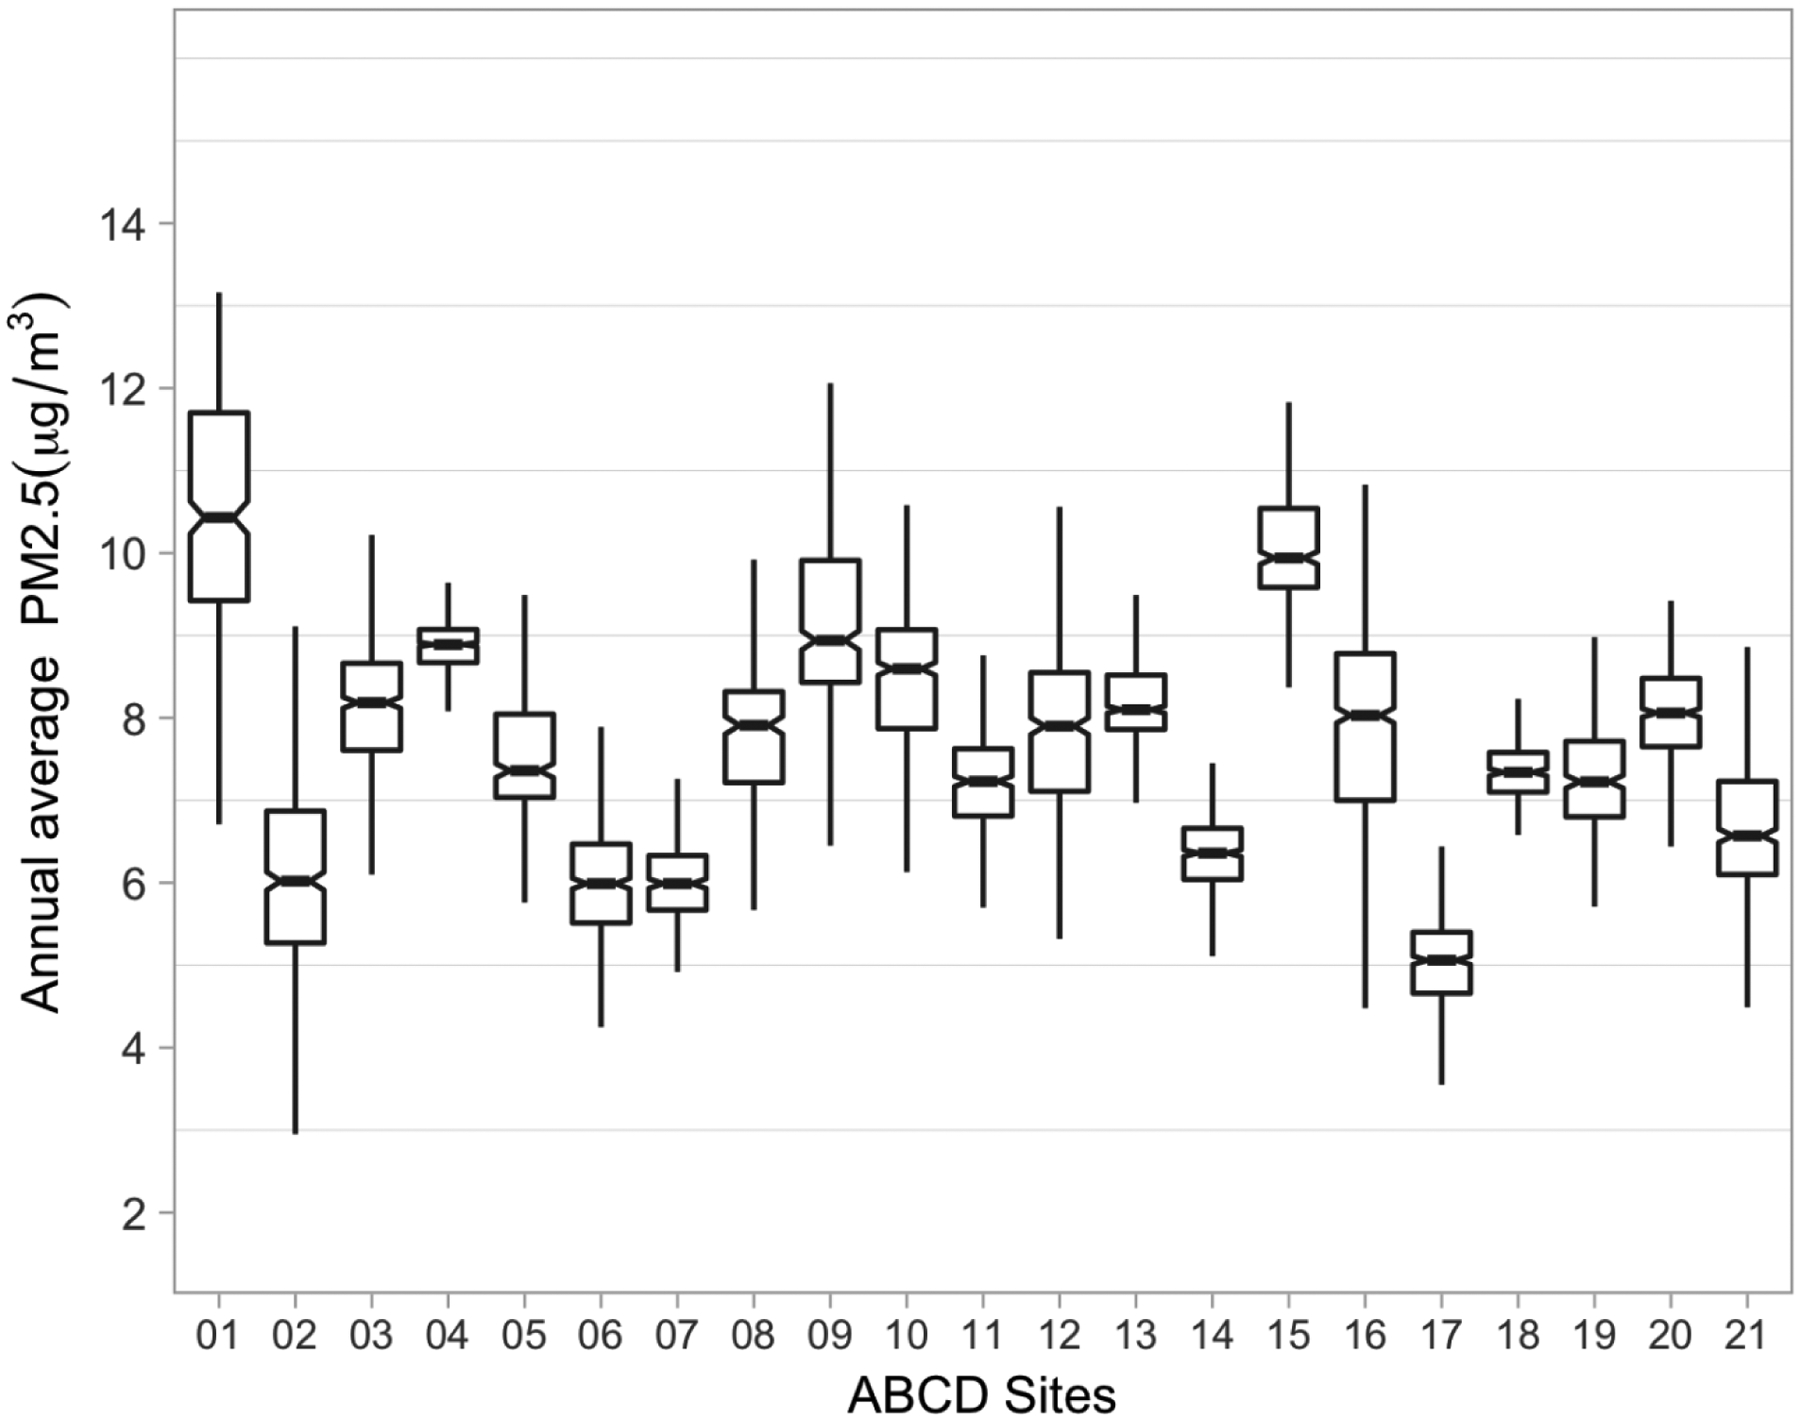
Fig. 1.

Distribution of baseline annual PM2.5 average (based on daily estimates at the primary residential location) by ABCD study site (N=10,343) in the ABCD Study.
Footnote: The line within the box marks the median; the boundaries of the box indicate the 25th and 75th percentiles; horizontal bars denote the variability outside the upper and lower quartiles (ie, within 1.5 IQR of the lower and upper quartiles).
