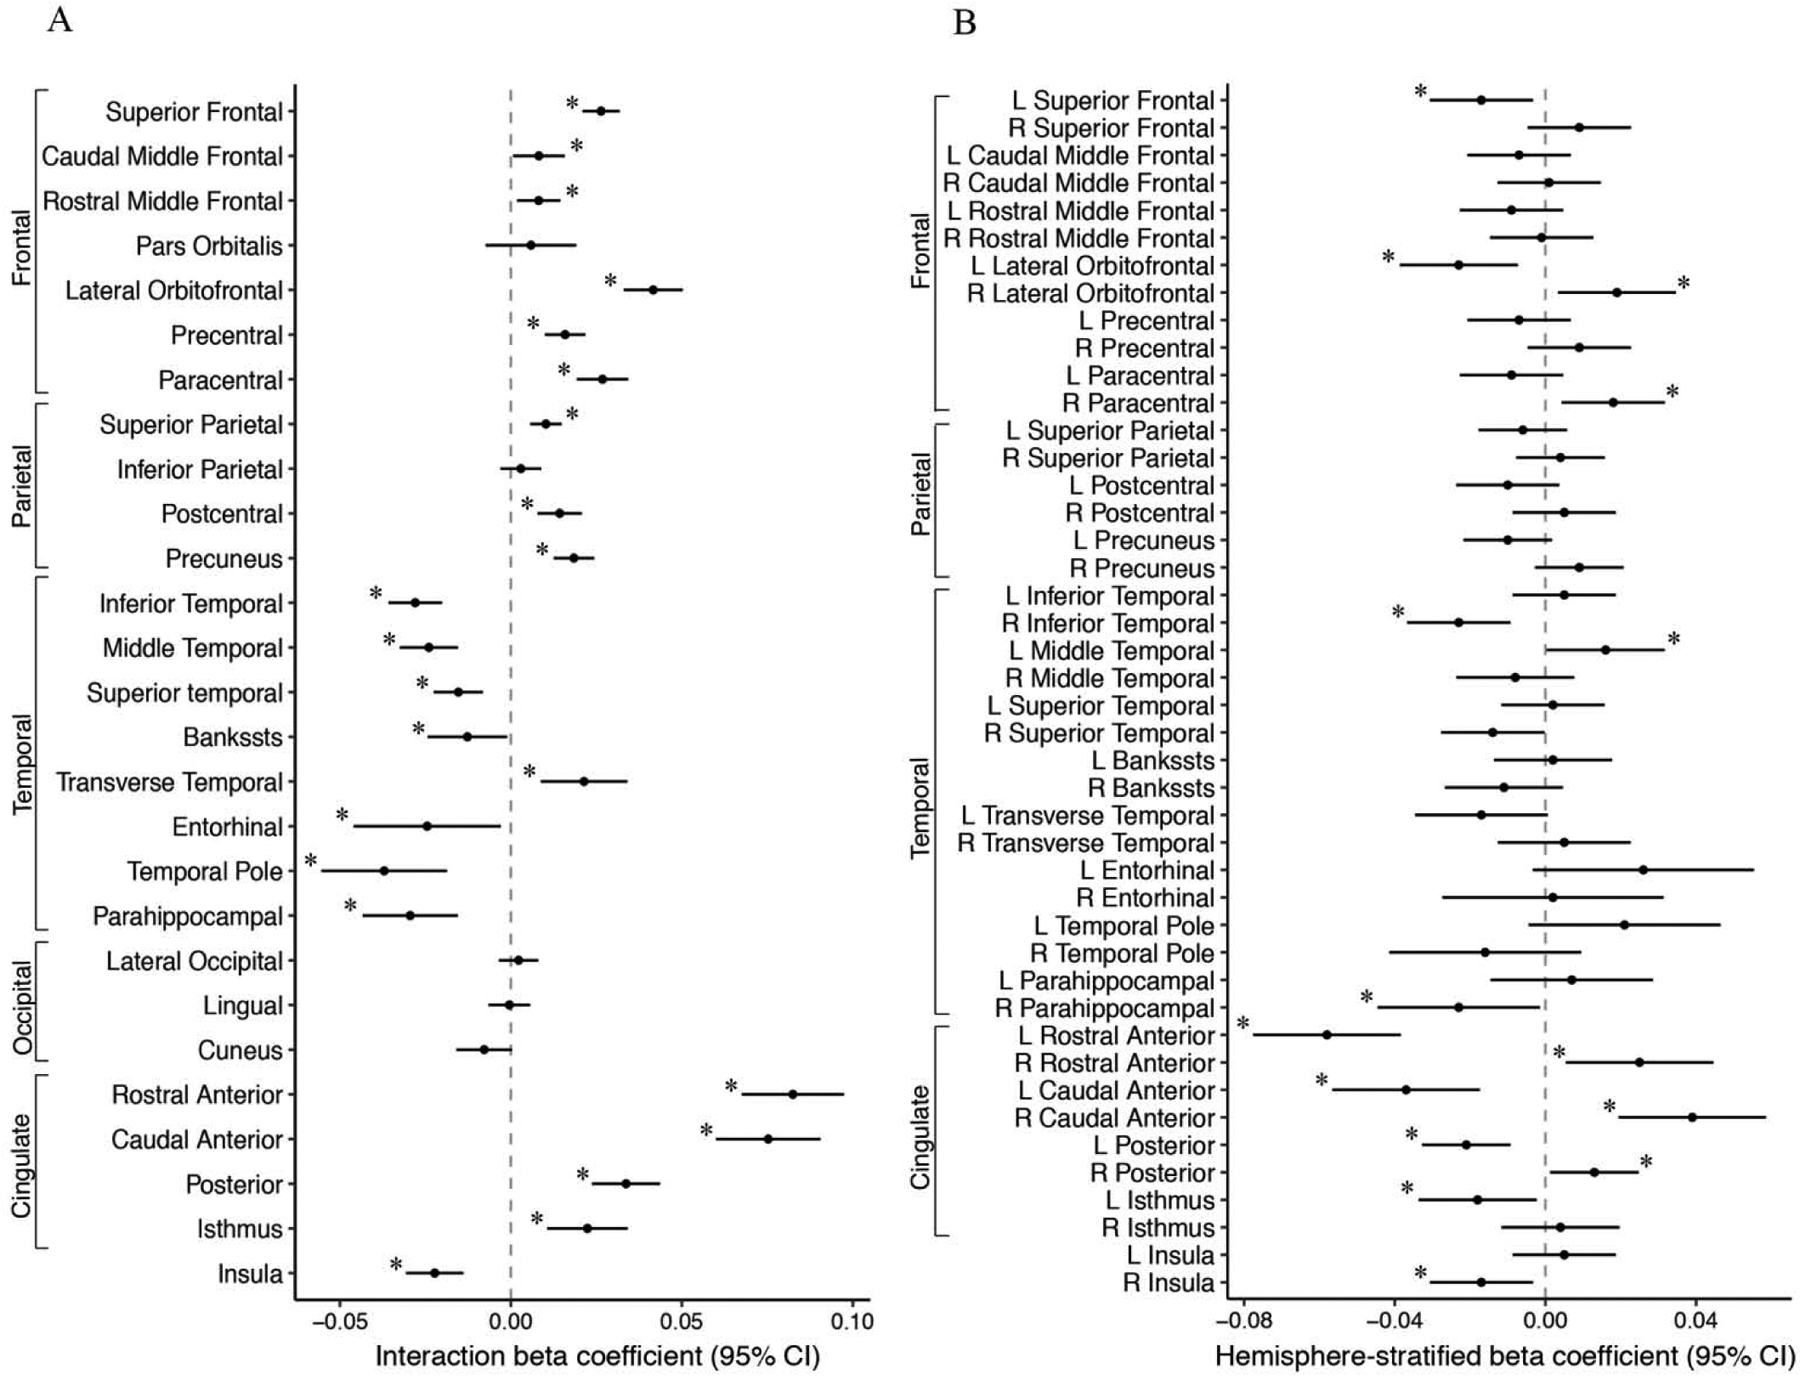
Figure 3.

A) PM2.5-by-hemisphere interaction effect estimates; and B) Region-specific PM2.5 effect estimates on cortical thickness (mm) that differed statistically by hemisphere in the ABCD Study.
Footnote: A) Visualization of beta coefficients (95% CI) denoting regions associated with PM2.5 -by-hemisphere interaction presented with ‘*’ for passed False Discovery Rate correction. B) Visualization of beta coefficients (95% CI) denoting regions associated stratified post-hoc analyses within a given hemisphere derived from significant PM2.5 -by-hemisphere interactions presented with ‘*’ p < 0.05. PM2.5 units are 5 μg/m3.
