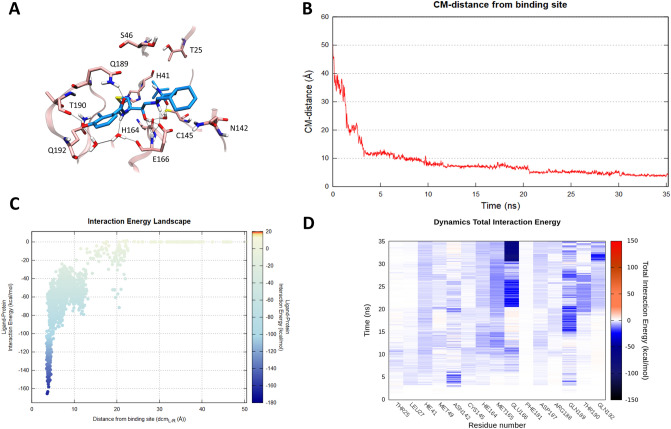
Figure 4.
This panel summarizes the recognition pathway of Nelfinavir against the SARS-CoV-2 main protease. (A) Nelfinavir conformation sampled in the last frame of the SuMD trajectory (cyan-colored molecule). The residues surrounding the binding site are reported in pink color. (B) Distance between the ligand center of mass (Cm) and the catalytic binding site of the Mpro during the SuMD simulation. (C) Interaction Energy Landscape describing the protein–ligand recognition process; values are arranged according to the distances between ligand and protein target mass centers. (D) Dynamic total interaction energy (electrostatic + vdW) computed for most contacted Mpro residues.

