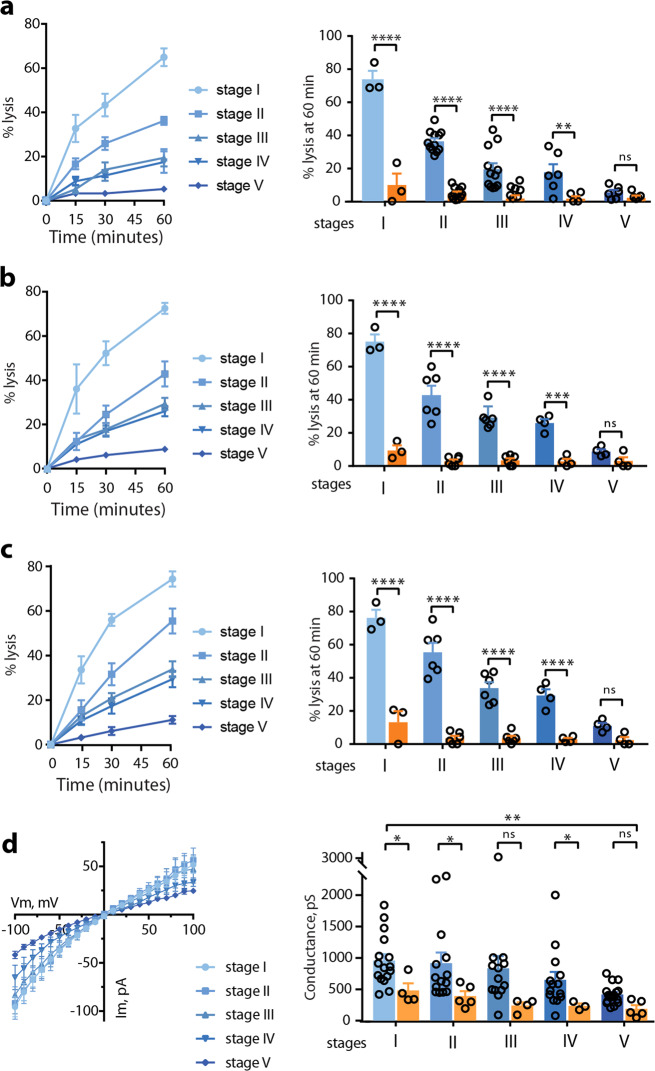
Fig. 2. NPPs decline along gametocytogenesis.
a–c Sorbitol-induced (a), alanine-induced (b) and PhTMA+-induced (c) isosmotic lysis of GIE from stage I to stage V. Left: Kinetics of isosmotic lysis during 60 min. Right: % lysis at 60 min with (orange) or without (blue) 100 µM NPPB. Circles indicate the number of independent experiments and error bars show the SEM. Statistical significance is determined by one-way ANOVA with Sidak correction for multiple comparisons. d Left: I−V plot from patch experiments on GIE from stage I to stage V. Right: Whole-cell conductance calculated at −100 mV on GIE from stage I to stage V with (orange) or without (blue) 100 µM NPPB. Circles indicate the number of independent experiments and error bars show the SEM. Statistical significance is determined by a Mann−Whitney test at each gametocyte stage and by ANOVA test for trend between stage 1 and stage 5, p = 0.0013, slope −134.7 ± 40.03 pS/stage transition. ****p < 0.0001, ***p < 0.001, **p < 0.01, *p < 0.05, ns: non-significant difference.

