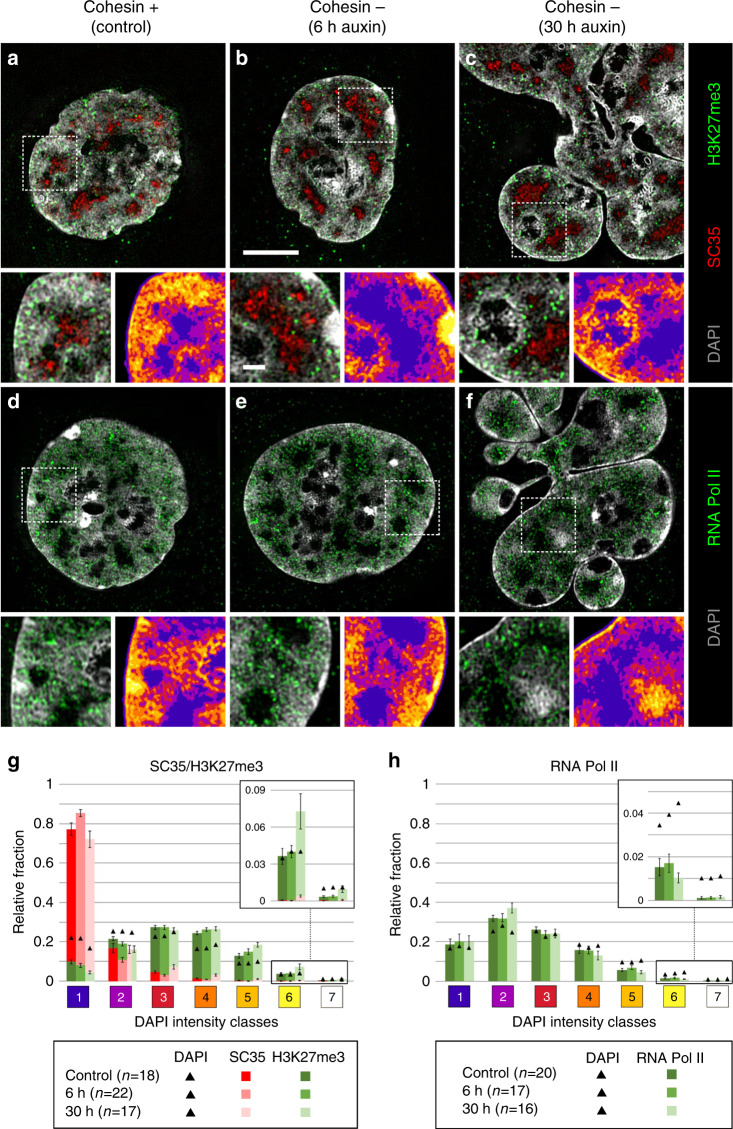
Fig. 4. Congruent 3D topography of SC35, H3K27me3, and RNA Pol II in nuclei of control and cohesin depleted cells.
a–f DAPI-stained nuclear mid-sections (gray) displayed from 3D SIM image stacks of control nuclei (a, d), of pre-mitotic cohesin depleted nuclei after 6 h auxin treatment (b, e), and post-endomitotic MLN after 30 h auxin treatment (c, f) reveal the topography of immunostained SC35 (red) and H3K27me3 (green) (a–c), and active RNA Pol II (red) (d–f). Scale bar: 5 µm. An enlargement of a representative boxed area is shown beneath each mid-section together with the color-coded DAPI intensity heat map (compare Fig. 3). Scale bar: 1 µm. SC35 marked splicing speckles are located in the interchromatin compartment (IC, blue), H3K27me3 marks are distributed within neighboring chromatin domain clusters; RNA Pol II is mainly enriched in chromatin lining the IC (purple), but also extends into the IC, whereas it is largely excluded from densely compacted chromatin regions (brown and yellow). g, h 3D image analyses of 3D SIM stacks show the relative fraction of g SC35 (red) and H3K27me3 (green) signals (control: n = 18, 6 h: n = 22, 30 h: n = 17 cells from two independent experiments), and h of active RNA Pol II (green) (control: n = 20, 6 h: n = 17, 30 h: n = 16 cells from two independent experiments) in comparison to DAPI intensity classes 1–7 marked as black triangles. 6 and 30 h, respectively, denote incubation time in auxin. Data are represented as mean ± SEM. Source data are provided as a Source Data file.

