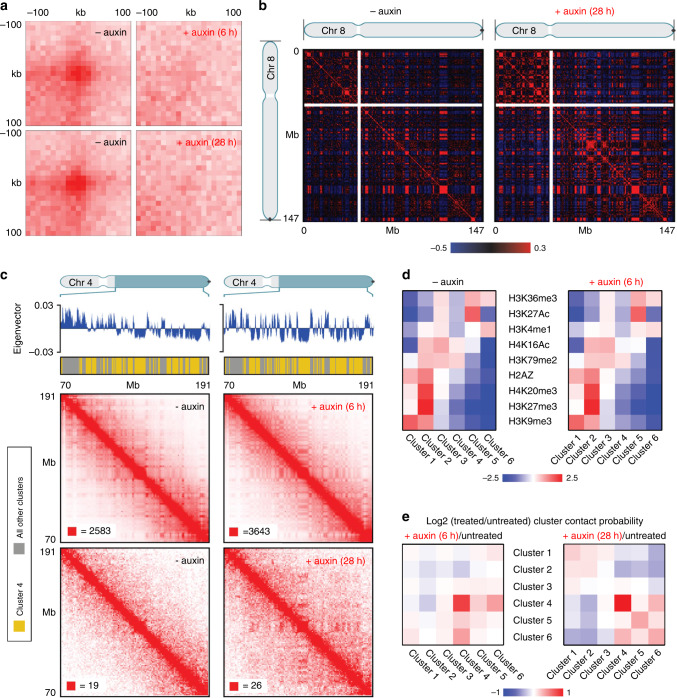
Fig. 5. Hi-C data indicate elimination of chromatin loops, but the maintenance of A and B compartments in cohesin depleted pre- and postmitotic cells.
a Aggregate peak analysis (APA) plots using loops identified in HCT116-RAD21-mAC cells before and after 6 h of auxin treatment (top) or before and after 28 h of auxin treatment (bottom). For each of the treated timepoints, the matched untreated control (harvested at the same time) is plotted next to it. The plot displays the total number of contacts that lie within the entire putative peak set at the center of the matrix. Loop strength is indicated by the extent of focal enrichment at the center of the plot. b Pearson’s correlation maps at 500 kb resolution for chromosome 8 before (left) and after (right) 28 h of auxin treatment. The plaid pattern in the Pearson’s map, indicating compartmentalization, is preserved in cohesin depleted nuclei even after 28 h of auxin treatment. c Contact matrices for chromosome 4 between 70 and 191 Mb at 500 kb resolution before (left) and after (right) cohesin depletion. The 6 h cohesin depletion time is shown on top, and 28 h depletion time on the bottom. K-means clustering of histone modifications at 25 kb resolution into six clusters annotates loci corresponding to specific subcompartments. Interactions for loci in cluster 4 (arbitrary numbering, annotated in yellow on top tracks) are strengthened after both 6 and 28 h of cohesin depletion. All loci belonging to clusters other than cluster 4 are annotated in gray in the top track. The max color threshold (red) of the heatmap is illustrated in the lower-left corner of each heatmap, the minimum color threshold (white) is 0 reads. d Log-2 fold ratios of between-cluster Hi-C contact probabilities post- and pre- cohesin degradation are shown for the six clusters identified via K-means clustering of histone modifications. Cluster 4 shows strong contact probability enrichment after cohesin degradation at both the 6 h and 28 h timepoints. e For each of the six histone modification clusters, the average log2-fold enrichment for each histone modification over all loci in that cluster is shown both post- and pre- cohesin degradation. Patterns of histone modifications across the clusters as unchanged by cohesin degradation.

