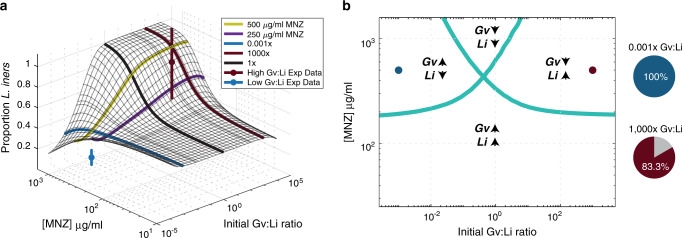
Fig. 3. Initial Gv:Li ratios dictate final microbial populations.
a Surface plot illustrates model predictions for proportion of Li relative to Gv 48 h at different starting Gv:Li ratios (x-axis) and at different doses of MNZ (y-axis). Experimental validation was performed in in vitro co-cultures of Li and Gv (n = 18 independent, biological replicates for each ratio) and is plotted on the surface, with mean ± SD represented by nodes and vertical lines. b Phase diagram of microbial growth dynamics 48 h after exposure to various MNZ doses, dots indicate experimental conditions evaluated. There are four possibilities: Both Gv and Li populations are increased after treatment, both Gv and Li populations are decreased, only the Gv population is increased and only the Li population is increased. Pie charts indicate the fraction of experimental samples that agree with the predicted trends (right).

