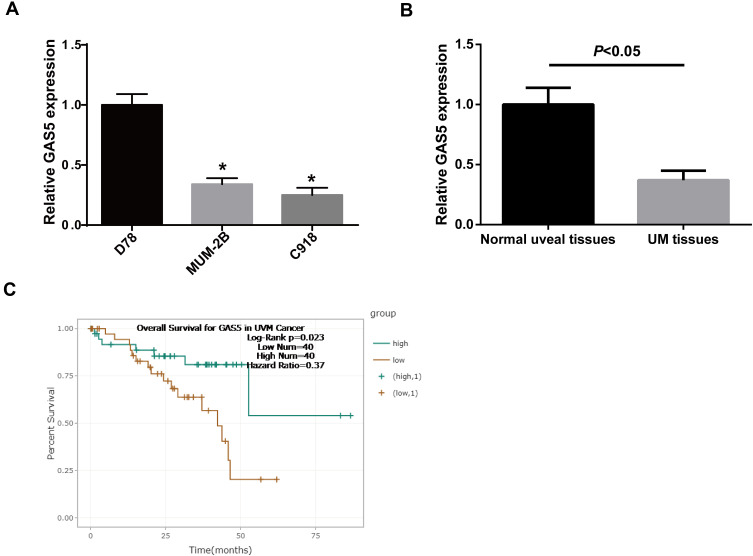
Figure 1.
GAS5 is downregulated in UM. (A) qRT-PCR analysis was conducted to quantify the expression levels of GAS5 in UM cell lines and D78 cells. (B) Expression levels of GAS5 in UM tissues and normal uveal tissues were determined by qRT-PCR analysis. (C) Analysis of the relationship between GSA5 expression levels and the overall survival rates of UM patients using starBase. Data are shown as mean ± SD. *P<0.05.

