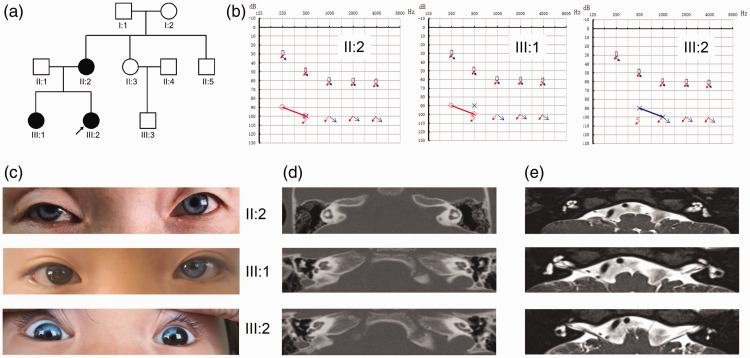
Figure 1.
Pedigree diagrams (a), audiogram information (b), iris evaluation (c), the temporal computed tomography (CT) scan (d), and head magnetic resonance imaging (MRI) results (e). Clinical examinations of the family. (a) Pedigree diagram of the family. Filled symbols represent affected individuals (II: 2, III: 1 and III: 2); empty symbols represent unaffected members; squares and circles represent men and women, respectively, and the arrow denotes the proband (III:2). (b) Audiograms of the affected family members, indicating bilateral severe sensorineural deafness. The horizontal axis shows tone frequency (Hz); the vertical axis shows hearing level (dB). (c) Iris evaluation of the affected siblings. The mother (II-2) and the proband (III-2) presented with bilateral blue irises, and the sister (III-1) had a blue left iris. (d) and (e) Temporal CT scan and head MRI results of the affected family members, showing no obvious abnormalities.

