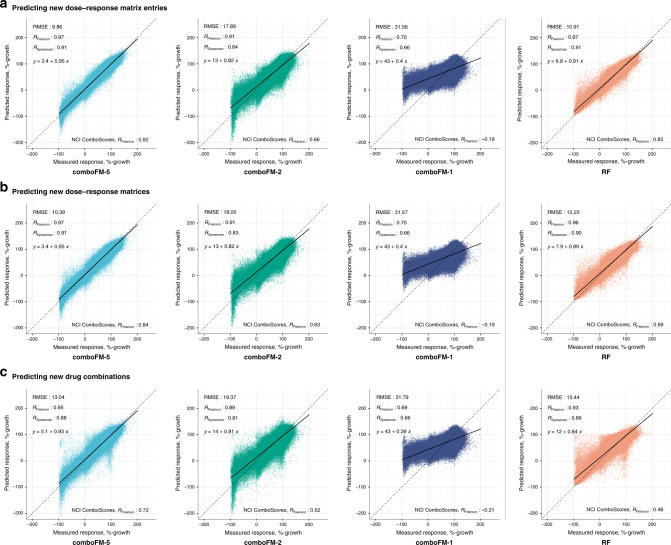
Fig. 2. Predictive performance of 5th (comboFM-5), 2nd (comboFM-1) and 1st order comboFM (comboFM-1), and random forest (RF) as scatter plots between the measured and predicted dose–response matrices.
The responses were measured by percentage growth in the three prediction scenarios: a new dose–response matrix entries, b new dose–response matrices, and c new drug combinations. Root mean squared error (RMSE), Pearson correlation (RPearson) and Spearman correlation (RSpearman) for the drug combination response prediction are reported as averages over 10 outer CV folds. The Pearson correlation of the NCI ComboScores is reported as an average over all computed NCI ComboScores, computed based on the predicted dose–response matrices. Trend line and its equation are shown for each scatter plot.

