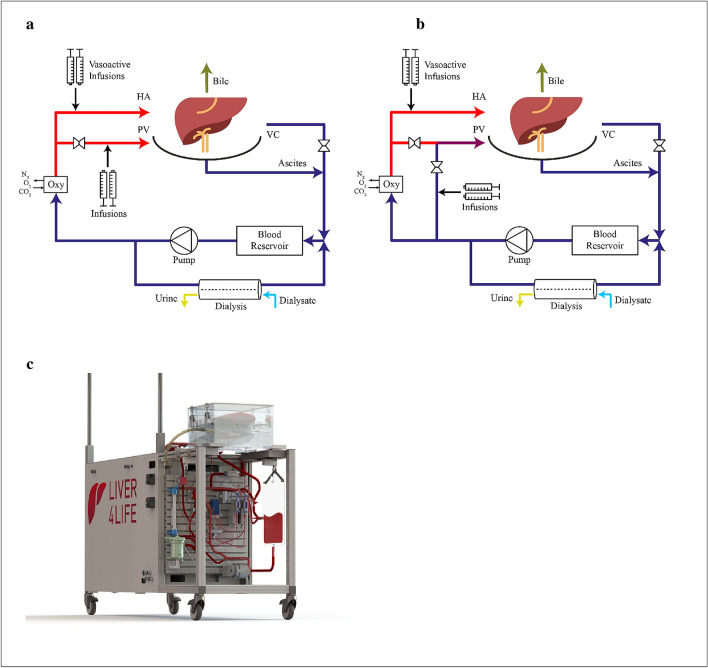
Figure 1.
Schematic illustration of the perfusion loops for arterial PV (a) and venous PV groups (b). (a) In arterial PV group, arterial blood was provided in the PV with total PV flow rate of 1 l/min. For this purpose blood flow was split after the oxygenator into the PV and HA lines with the same oxygen content. (b) In venous PV group, venous blood was provided in the PV with total PV flow rate of 1 l/min. For this purpose, oxygen deprived blood from the liver output was mixed with oxygenated blood after oxygenator. Flow rates in the arterial and deoxygenated lines were automatically adjusted to maintain an oxygen saturation at the liver output/outlet of ~ 65%. (c) Representative illustration of the perfusion machine. HA hepatic artery, PV portal vein, VC vena cava.

