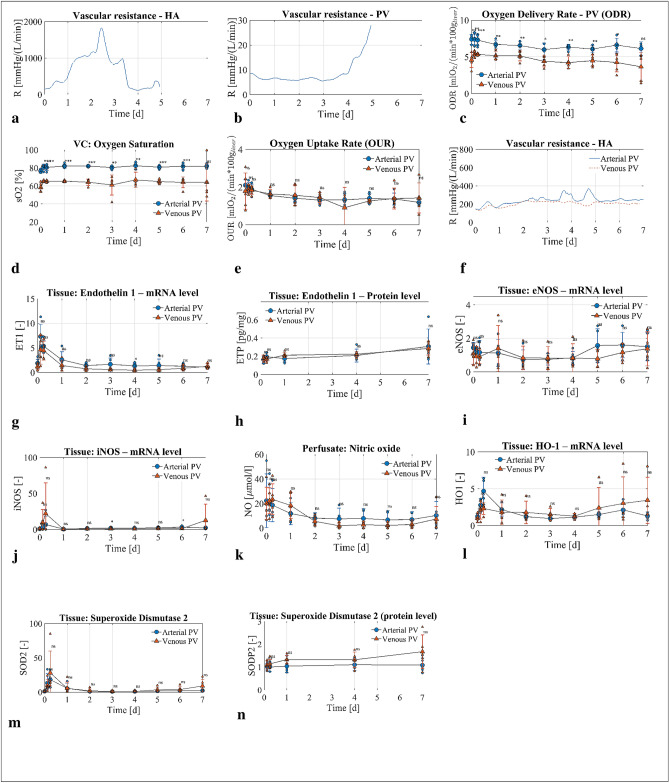
Figure 2.
Oxygen delivery, vasculature resistance and patterns of vasoactive substance activation in experimental groups. Arterial PV group blue circles, n = 5 experiments, venous PV group red triangles, n = 5 experiments. (a,b) Representative experiment data of the HA and PV resistance from Group 0 without Nitroprussiat application. The increased HA resistance resulted in a decreased flow between perfusion day 1 and 3. From perfusion day 4, HA resistance decreased and was accompanied with increased PV resistance and absence of bile flow. (c) Oxygen delivery rate in the PV was higher with arterial PV compared to venous PV. (d,e) Oxygen saturation in the vena cava was higher in arterial PV group compared with venous PV group with no difference in oxygen uptake rate between groups during perfusion. (f) Resistance in arterial PV and venous PV groups controlled with Nitropurssiat. (g–l) Vasoactive substance release at mRNA and protein level without significant difference among experimental groups; (g) Endothelin-1 at mRNA level, (h) Endothelin-1 at protein level in tissue, (i) endothelial NO synthase (eNOS) and (j) inducible NO synthase (iNOS) at mRNA level, (k) NO level in perfusate, (l) heme oxygenase 1 at mRNA level. Superoxide dismutase (SOD) at mRNA (m) and protein (n) levels. P value * < 0.05, ** < 0.01, *** < 0.001. ns not significant.

