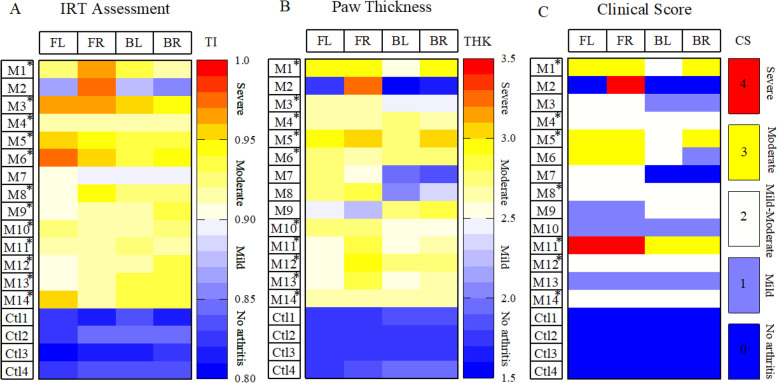
Fig. 6.
Heatmaps showing severity arthritis criteria. Disease severity quantification through a joint temperature assessment, b paw thickness measurement (mm), and c clinical score analysis of individual paws in 14 CIA (M1 to M14) and 4 control (Ctl1 to Ctl4) mice on day 28. Colors represent the score assigned to the severity of inflammation where darker blue represents absence of arthritis, and white, yellow, and red indicate mild to severe form of arthritis in each category. Asterisk corresponds to mice identified as “moderate to severe” based on each assessment method. FL, front left; FR, front right; HL, hind left; HR, hind right; TI, temperature index; THK, thickness; CS, clinical score; M, mouse; Ctl, control

