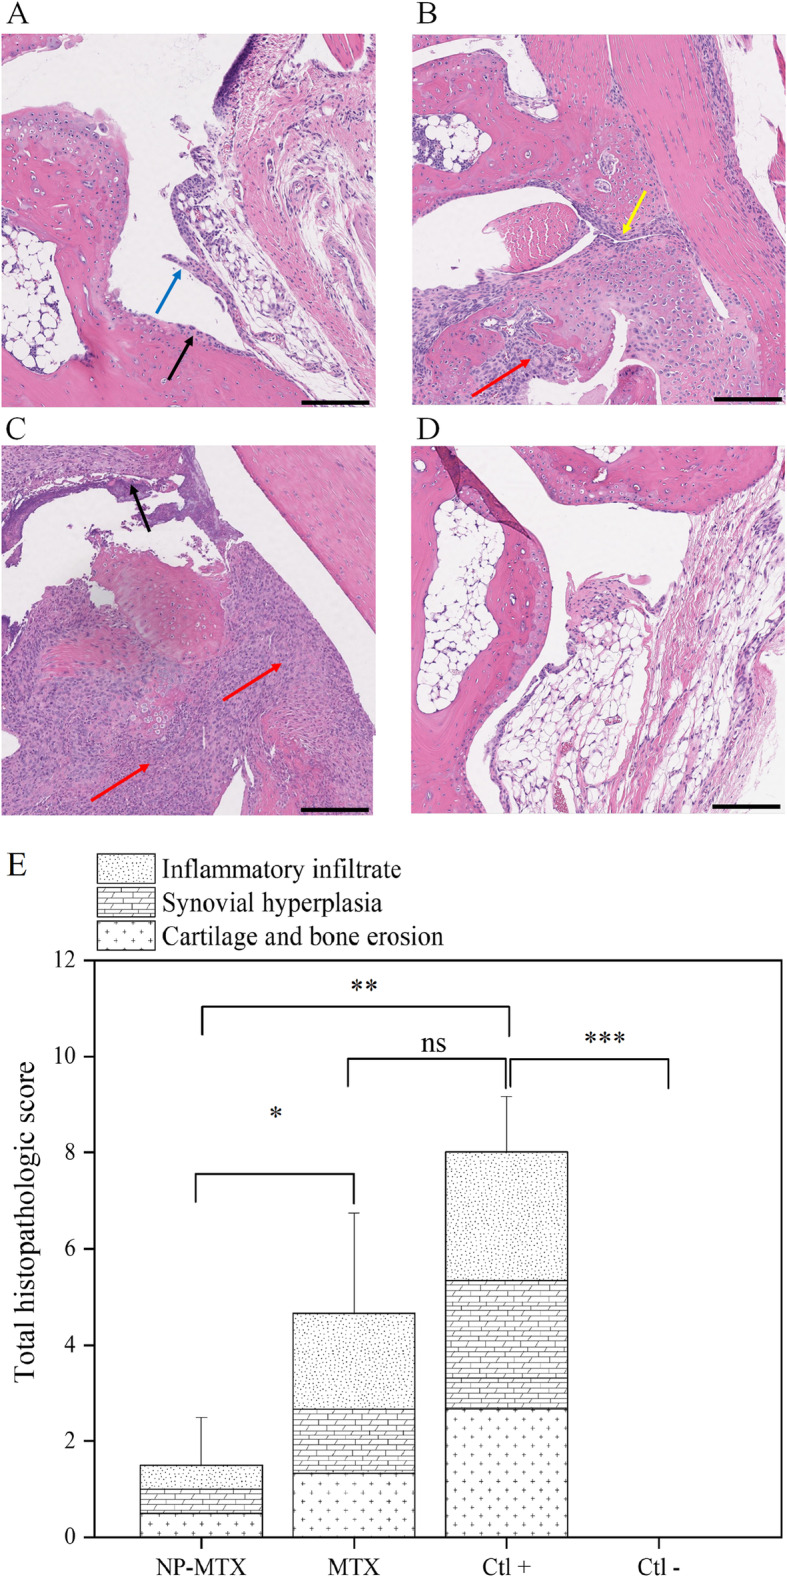
Fig. 9.

Representative optical microscopy sections of H&E stained ankle joints. CIA mice treated with a NP-MTX, b MTX, and c vehicle. d Healthy mice treated with vehicle are used as negative control. e A histopathologic score was determined based on arthritis severity for all treatment groups and the controls and graphed as mean + SD; n = 4. The Y-axis score is cumulative, where higher scores equal an increase in severity. Red arrow, inflammatory cell infiltration; blue arrow, synovial hyperplasia; black arrow, cartilage erosion; and yellow arrow, synovial proliferation. The P values between the means are as follows: ***P < 0.0005; **P < 0.001; *P < 0.05; ns, non-significant. Scale bars = 100 μm
