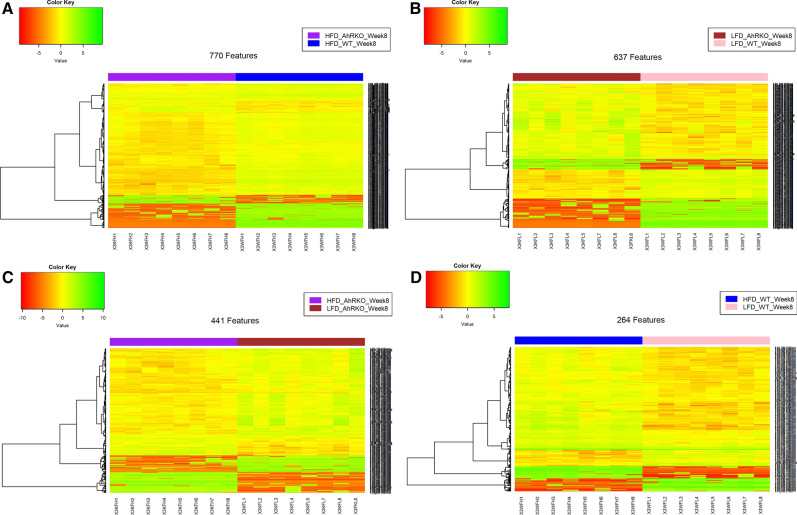
Fig. 6.
Heatmap visualization of metabolite data at week 8 using the Euclidean distance method and the Ward clustering algorithm. a Differentially abundant features between AhRKO mice fed HFD and WT mice fed HFD (FDR-adjusted p-value < 0.1 and fold-change > 1.2 or < 0.8). b Differentially abundant features between AhRKO mice fed LFD and WT mice fed LFD (FDR-adjusted p-value < 0.1 and fold-change > 1.2 or < 0.8). c Differentially abundant features between AhRKO mice fed HFD and AhRKO mice fed LFD (FDR-adjusted p-value < 0.1 and fold-change > 1.2 or < 0.8). d Differentially abundant features between WT mice fed HFD and WT mice fed LFD (FDR-adjusted p-value < 0.1 and fold-change > 1.2 or < 0.8)

