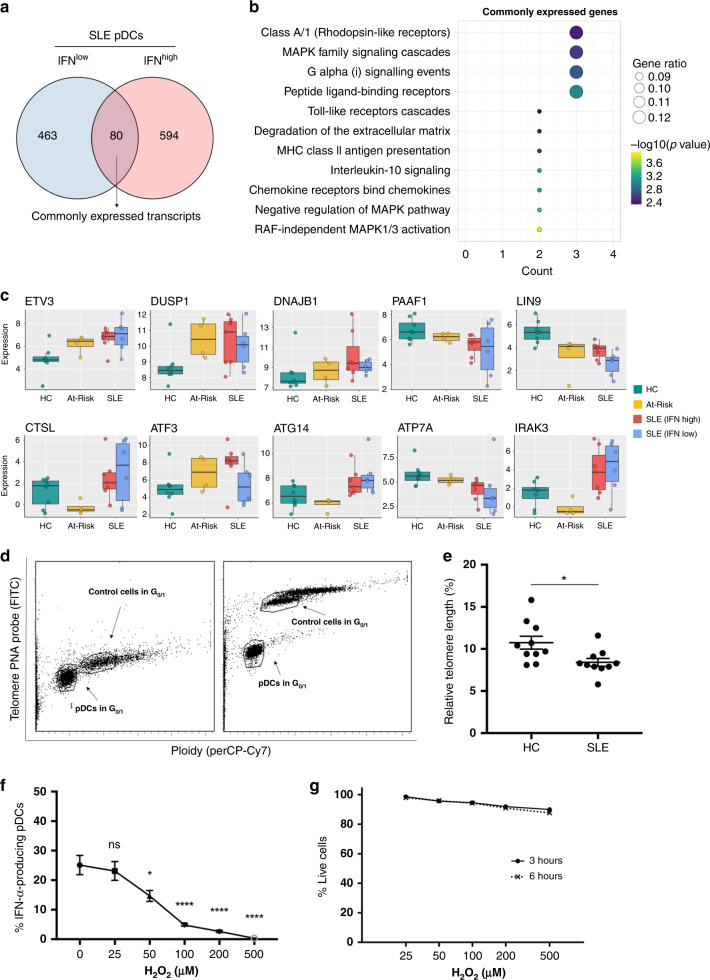
Fig. 6. pDCs have features of cellular stress and immune senescence in autoimmunity.
a Venn diagram showing the number of differentially expressed transcripts (n = 80) common to both IFNlow and IFNhigh pDCs from SLE patients compared to pDCs from HC. b Reactome Pathway Enrichment in DEGs in differentially expressed genes in IFNlow and IFNhigh pDCs from SLE patients shown in a. c Expression level of representative genes differentially expressed in both IFNlow and IFNhigh pDCs from SLE patients in comparison with pDCs from HC. d Purified pDCs from freshly isolated PBMCs were hybridized without (d; right) or with (d; left) telomere PNA probe. Gates were set in G0/1 phase for both sample cells (pDCs) and tetraploid control cells (1301 cell lines). e Determination of the relative telomere length as the ratio between the telomere signal of pDCs purified from HC (n = 10) and SLE (n = 10) patients and the control cells (1301 cell line) with correction for the DNA index of G0/1 cells. f Viable cells were defined as double negative when stained for annexin V and 7-AAD; viability was assessed at 3 and 6 h after exposure to H2O2. One hundred percent of viable cells were defined by the number of cells alive of the non-H2O2-exposed cells (0 μM) at the two time points. g Freshly isolated PBMCs from healthy donors (n = 4) were exposed to H2O2 (0–500 μM) for 15 min. After H2O2 exposure, cells were washed thoroughly and resuspended in a culture medium before they were stimulated with 2 μM ODN 2216 for 6 h. The production of IFN-α by pDCs was measured in viable cells by intracellular staining. Data are represented as mean ± SEM. ns not significant; *P < 0.05; ****P < 0.001. The unpaired two-tailed t-test (e), 1-way ANOVA (g).

