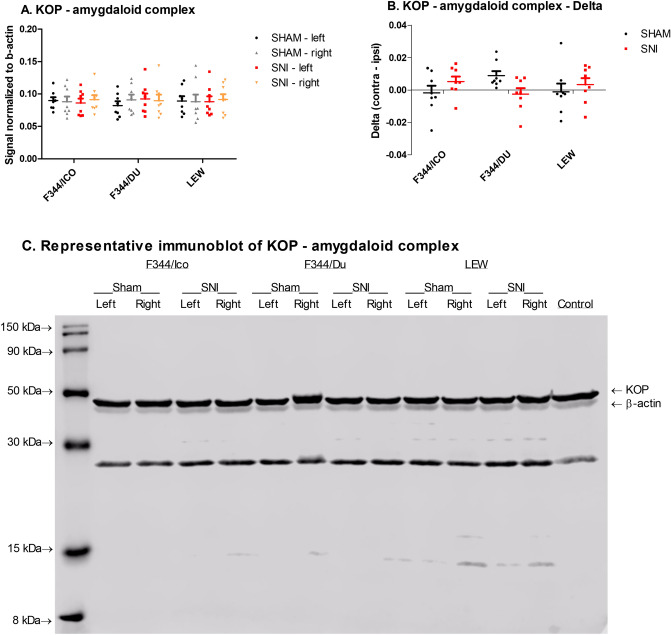
Figure 7.
KOP expression in brain and spinal cord of selected rat strains following SNI. (A) KOP in the amygdaloid complex. Two-way ANCOVA, strain*surgery, covariate right amygdaloid complex, showed significant strain*surgery-interaction. (B) KOP in the amygdaloid complex, expressed as the difference between right and left amygdaloid complex. Two-way ANOVA showed an almost significant strain*surgery-interaction. (C) Representative full length immunoblots of the amygdaloid complex, presenting the KOP-bands at ~ 43 kDa, and β-actin at ~ 42 kDa. The unspecified band at ~ 25 kDa was apparent after staining with the KOP-antibody, and likely represents degraded forms of the native KOP. Data are presented as mean ± S.E.M. of the signal normalized to β-actin in the sample. N = 8.

