
Figure 3. Confidence in Driving Ability Over Time and Perceived Driving Impairment at 2 Time Points.
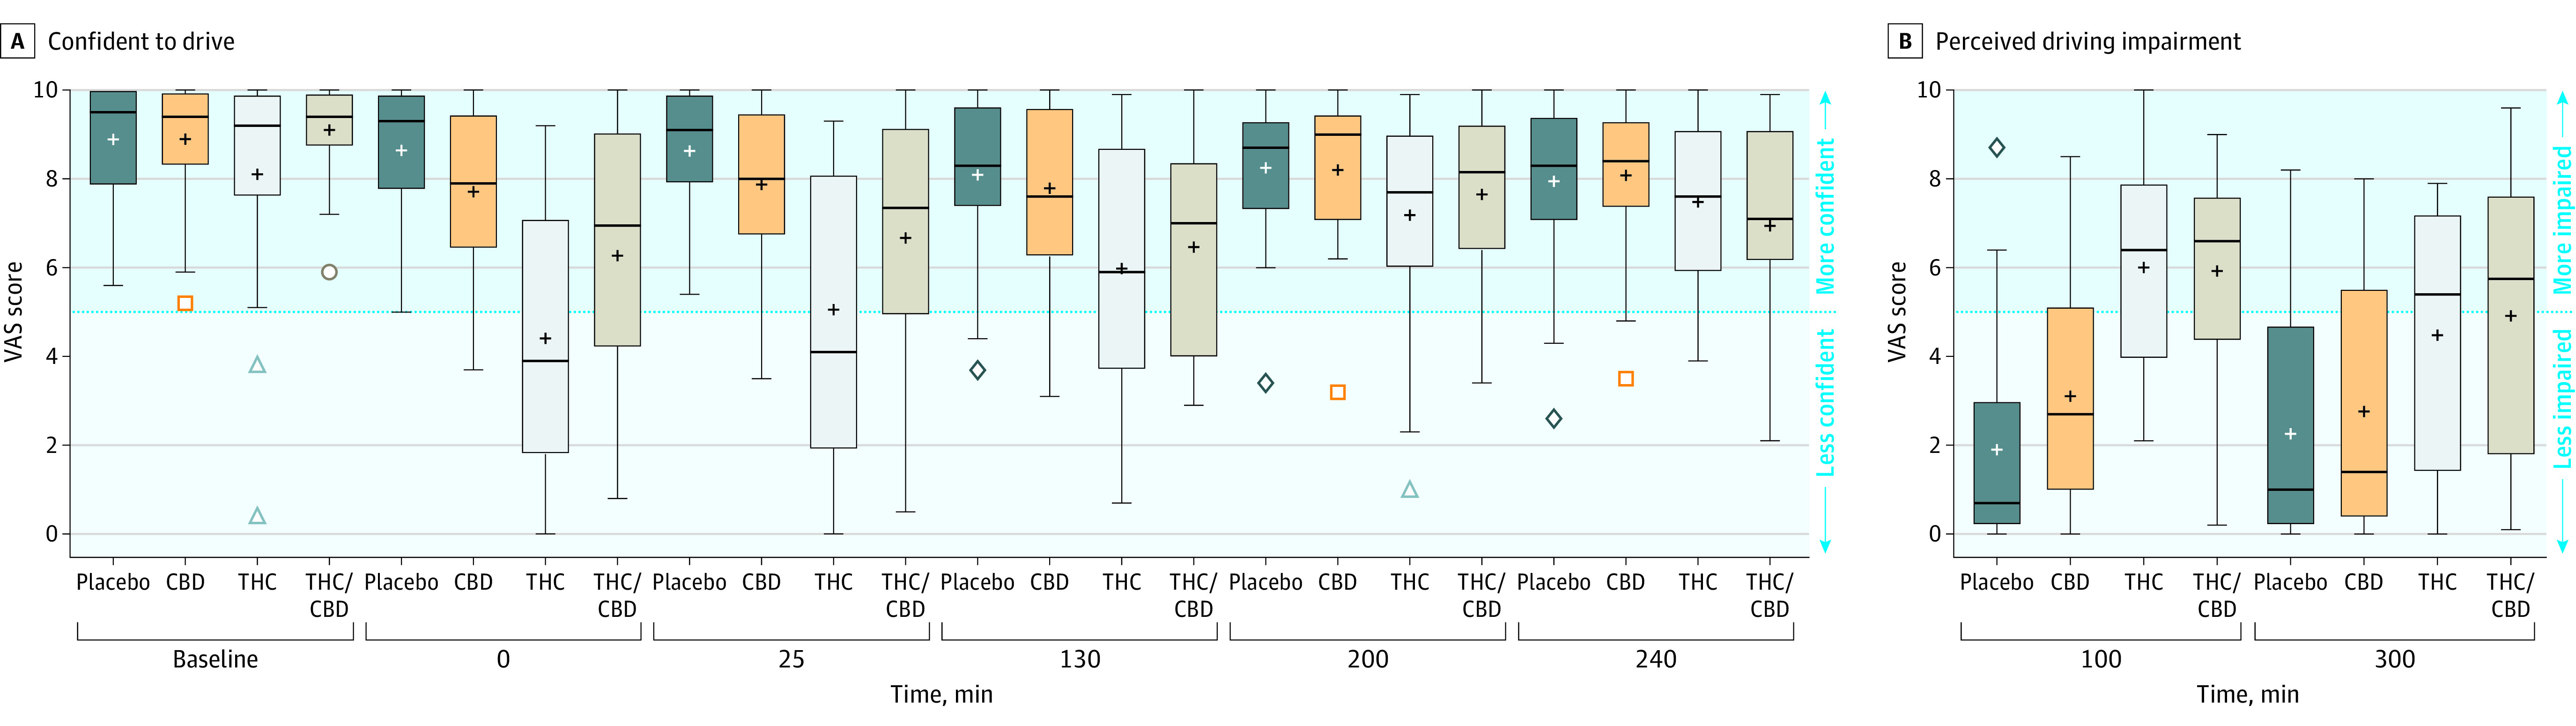
A, Baseline on the x-axis indicates predrug administration, minute 0 indicates the end of drug administration, all other values indicate time since vaporization. The visual analog scale (VAS) indicates mean values (range, 0-10 [not confident to very confident]). B, The VAS indicates mean values (range, 0-10 [less impaired to more impaired]) as assessed at the end of each on-road driving test.
Boxplot edges indicate the 25th and 75th quartile values. Horizontal bars indicate the median, and the plus signs indicate the mean. If there are no outliers (Q1 − 1.5 × [Q3 − Q1] and Q3 + 1.5 × [Q3 − Q1]), the whiskers indicate minimum and maximum values. Outliers (if present) are shown as colored symbols, the whiskers indicate the lowest and highest values that are not outliers. CBD indicates cannabidiol; THC, Δ9-tetrahydrocannabinol.