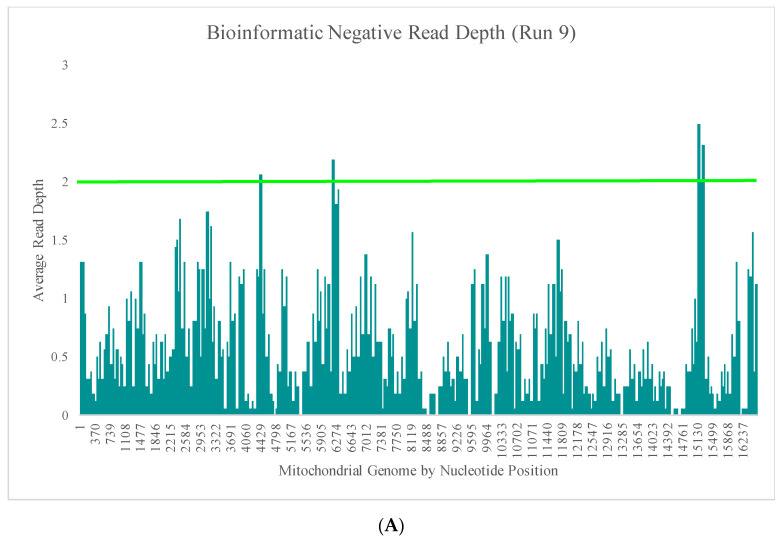
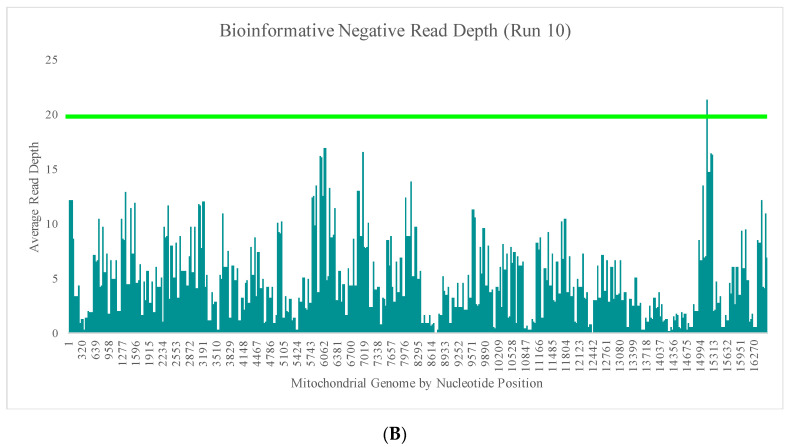
Figure 5.
(A) The average read depth across the mtGenome for the 16 bioinformatic negatives included in run 9 (1 ng input DNA). The horizontal bar indicates an average read depth of 2X. (B) The average read depth across the mtGenome for the 16 bioinformatic negatives included in run 10 (10 ng input DNA). The horizontal bar indicates an average read depth of 20X.


