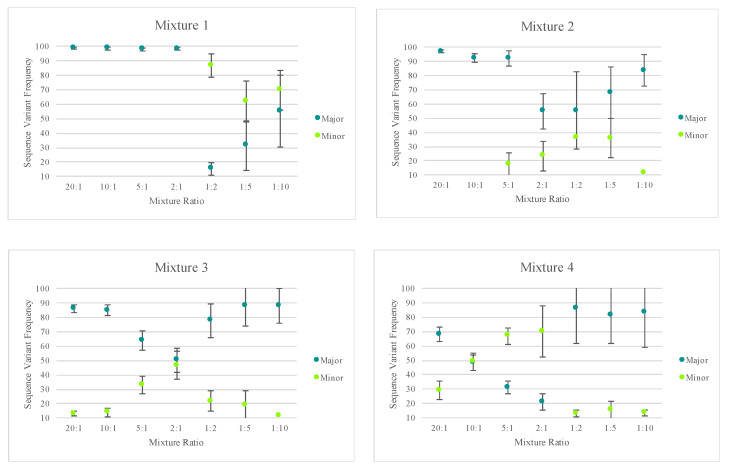
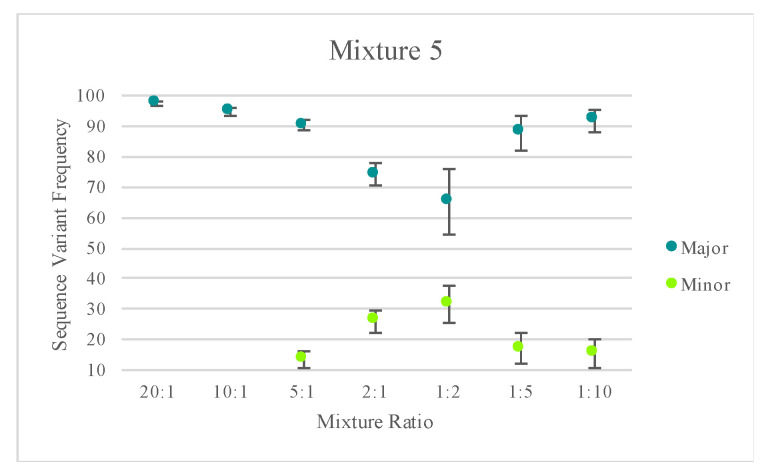
Figure 9.
The average sequence variant frequency (and standard deviations) for the major and minor contributor included in each mixed haplotype. Only one of the replicates for mixture series 5 was included in order to allow the standard deviations to reflect variability in the sequence variant frequencies of one mixture instead of reflecting the variability across several mixtures. The Y-axis starts at 10 to reflect the 10% point heteroplasmy threshold used for analysis.


