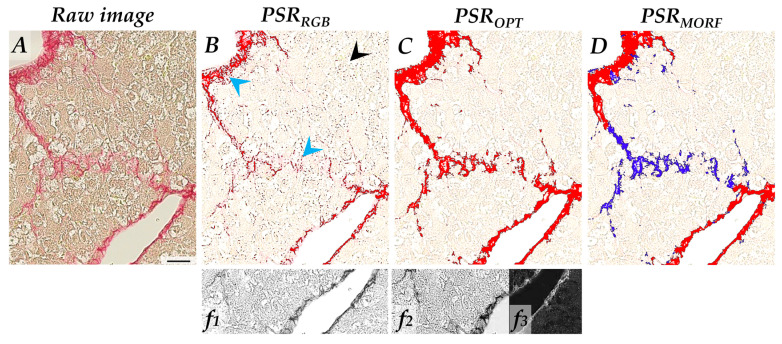
Figure 4.
Detection methods of discrete liver fibrosis stained in PSR. (A) Native image. (B) PSRRGB detection method, using RGB-G filter (insert f1). Staining detection is highlighted in red. Blue arrows: undetected pixels (false negative); black arrow: unsaturated pixels (false positive). (C) PSROPT detection method using optimized filters (inserts f2 and f3). Staining detection is highlighted in red. (D) Optimized detection is used for morphological segmentation (based on fiber density and staining intensity) with algorithm PSRMORF. Compact fibers are labeled in red and scattered fibers are labeled in blue. Refer to Supplementary Materials 2 and 3A for the filters, the detailed procedure, and the dynamic ranges of sensitivity. Scale bar = 50 µm.

