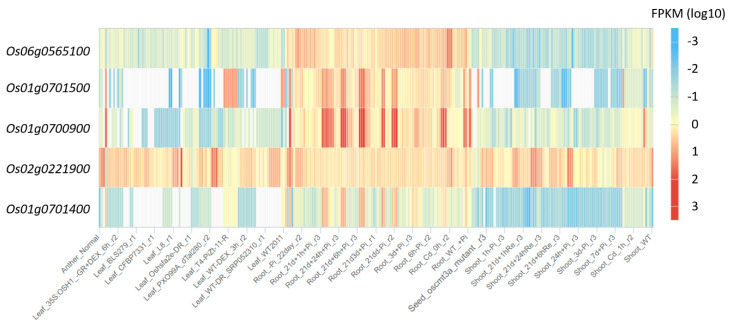
Figure 6.
Heat map chart of rice MAX1 gene expression profiles. FPKM—the number of fragments aligned per kilobases of the transcript per million mappable fragments from the total dataset. Description of the experiments was given in Table S9. White spots represent lack of data in this specific experiment to a given gene, each line corresponds to the single repetition.

