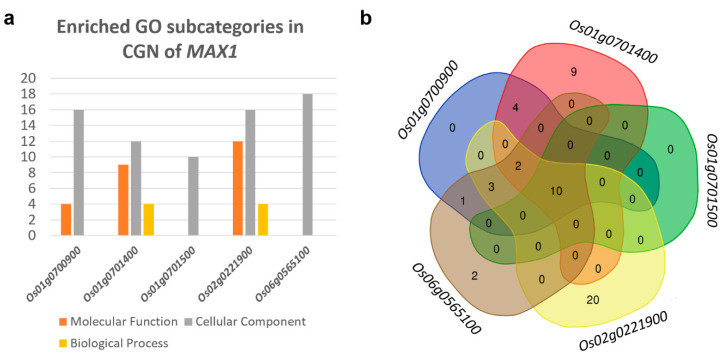
Figure 8.
Co-expression gene network (CGN) of MAX1 genes. (a) Mutual Rank (MR) of co-expression between MAX1s. (b) Number of genes that exhibited similar expression pattern, such as MAX1 homologues (genes with MR lower than 100). (c) The Venn diagram illustrates genes from CGN that are specific to each rice MAX1 gene and those that are common for different MAX1 homologues.

