Figure 1.
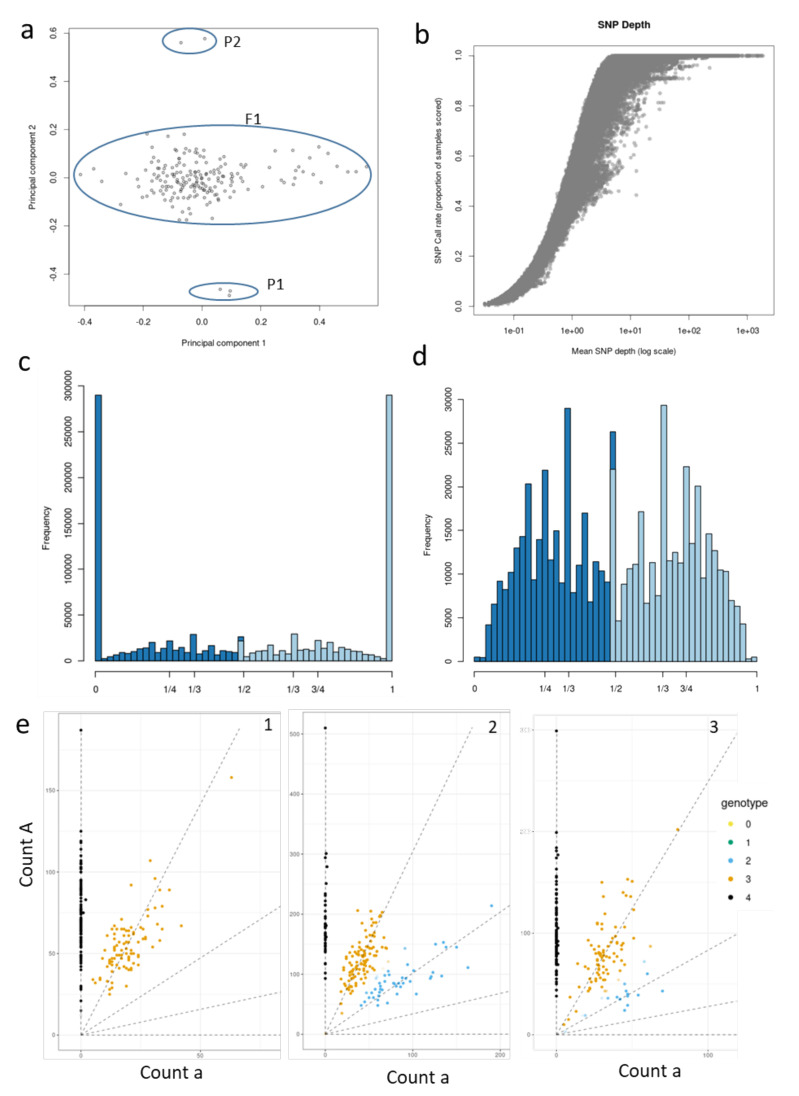
Variant calling and dosage estimates in a tetraploid A. chinensis F1 population. (a) Principal component analysis was performed by KGD software on the estimates of self-relatedness using the genetic dataset and the read depth information of the population (F1) and the parents P1 & P2; (b) is a plot of SNP call rates (which is the proportion of individuals observed with at least one allele) versus mean SNP depth (log scale); (c) shows allele frequency in one of the F1 genotypes for the most common class of homozygous variants (0 and 1); (d) shows heterozygous variants in the same genotype as in (c), with peaks at 1/3 and 1/2. Allele frequencies are 0, 1/4, 1/3, 1/2, 1/3, 3/4 and 1; (e) shows three different plots for genotype dosage estimates in F1 individuals for three different bi-allelic SNPs (1–3). The dots represent individuals between the read counts for the reference allele (A, y-axis) and the counts of reads for the alternative allele (a, x-axis). The dots are colored based on the five genotype dosages in tetraploids (ploidy+1) such that the genotypes 0, 1, 2, 3 and 4 refer to dosages aaaa, Aaaa, AAaa, AAAa and AAAA respectively.

