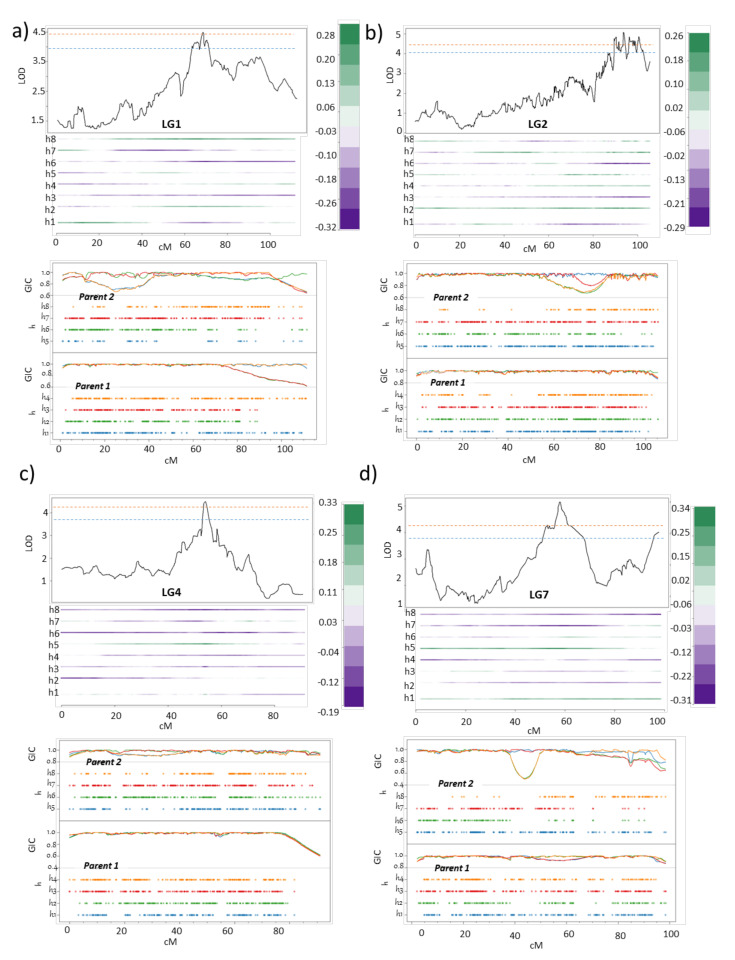
Figure 8.
Major quantitative trait loci (QTLs) for control of Pseudomonas syringae pv. actinidiae (Psa) resistance in the field. QTL and haplotype profile for four QTLs for Fld_Psa_score on (a) linkage group (LG)1, (b) LG2, (c) LG4 and (d) LG7, with corresponding profiles of the genotypic-information coefficient (GIC). The orange and blue dashed line indicates the chromosome-wide logarithm of the odds (LOD) threshold at α = 0.05 and 0.1, respectively. Just below the QTL profile is information on the location on the genetic map of the alleles contributing to the phenotype, as well as the source of the alleles from the parental homologues. P1 homologues are represented as h1–h4 and P2 homologues as h5–h8. The positive score/effect of the alleles from the respective homologue is identified by the strong green color, and the quantitative measure for this effect is provided in the legend beside the QTL graph. In addition to QTL information, the graphs are supplemented with the GIC profile of each parent, in two separate panels for each LG.

