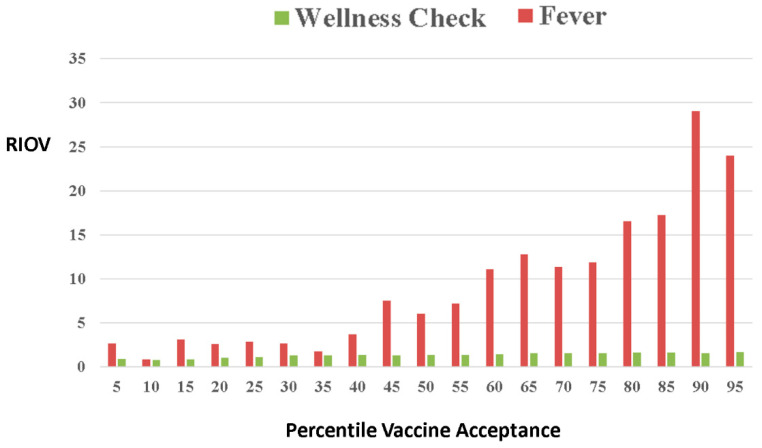
Figure 3.
Relative Incidence of Office Visit (RIOV) percentile vaccinated vs. unvaccinated design of analysis: power decreases from left to right; thus, a stable trend (increase or decrease) becomes noteworthy. The data shown are for the Relative Incidence of Office Visits (RIOVs) to average incidence ratio of billed office visits related to fever in the vaccinated compared to the unvaccinated (OVV/OVUV) conditions and for “Well Child” visit on the right. For all the clinical conditions studied, RIOV reflects the total number of billed office visits per condition per group, reflecting the total disease burden on the group and the population that it represents.

