Figure 3.
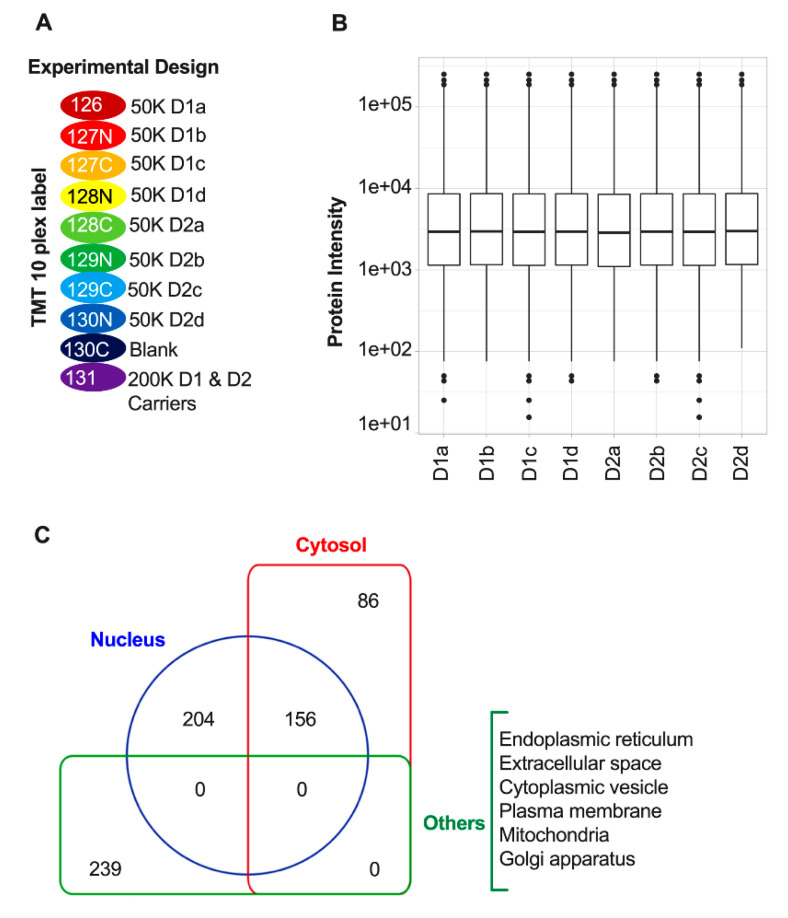
Experimental design and normalization. (A) Schematic for the design of the Tandem Mass Tag (TMT) 10-plex analyses of extracts from D1 and D2 nuclei. D1 or D2 nuclei in each biological replicate were FANS-sorted and 50,000 of the approximately 80,000 nuclei isolated from each of the two mice that constituted each of the four D1 and four D2 biological replicates (see Materials and Methods) were labeled with TMT reagents with the indicated reporter ions (RI). TMT label 130C and 131 represent blank and carrier channels, respectively (B) Protein abundance distribution of the MS3 data after quantile normalization. (C) Pie charts showing the cellular distribution of 685 proteins identified in quantitative proteomic analysis of D1 and D2 nuclei.

