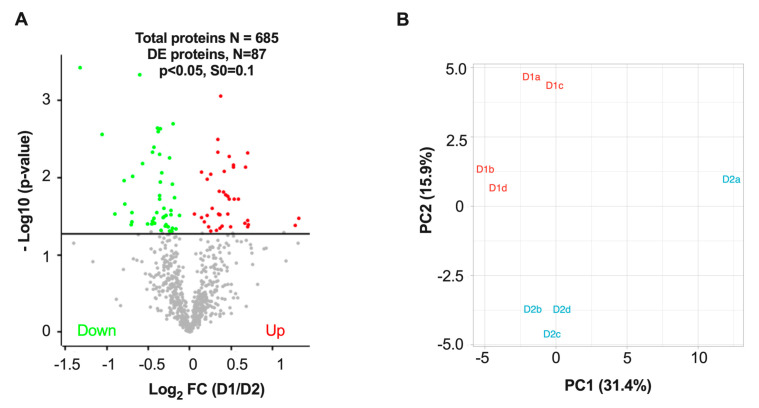
Figure 4.
Differential protein expression between D1 versus D2 nuclei. (A) Volcano plot showing 87 differentially expressed (DE) proteins (i.e., those proteins above the solid line at 1.3 that corresponds to p < 0.05) out of the 685 quantified proteins). (B) Principal component analysis (PCA) of data after quantile normalization and mean scaling separates samples corresponding to D1 versus D2 nuclei. The percentage in parentheses is the proportion of the total variation for each principal component.

