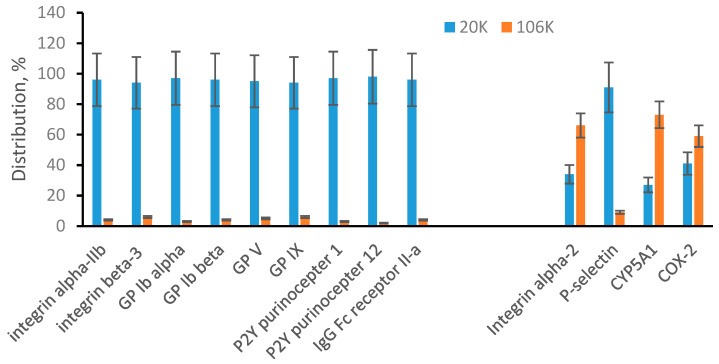
Figure 3.
Multiple reaction monitoring (MRM) analysis of microvesicles and exosomes from plasma. Plasma membrane-specific and endosomal membrane-specific proteins are arranged in two separated groups. Bar graphs show a percentile distribution of each listed protein between microvesicles (20K) and exosomes (106K). Data are represented as the mean ± SD (n = 6).

