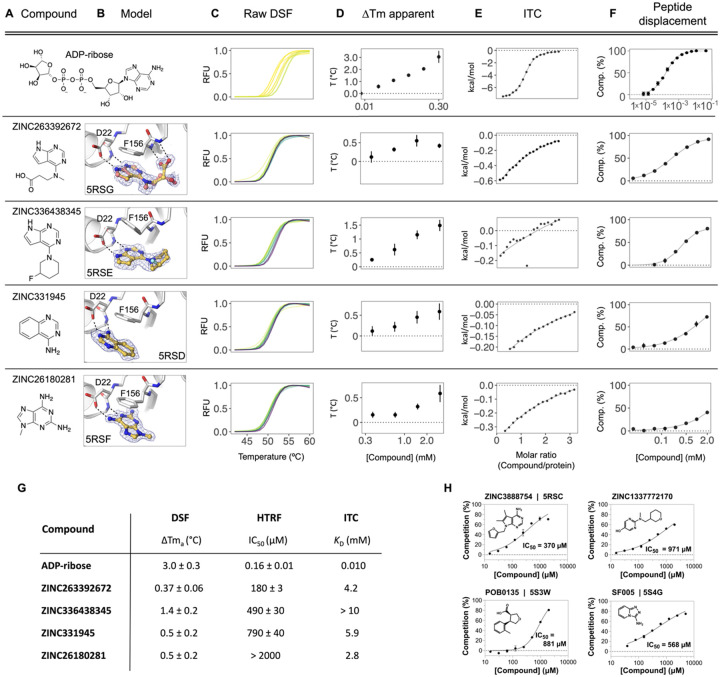
Figure 9. Biophysical corroboration of solution binding of crystallographic fragment hits by DSF, ITC and ADPr-peptide displacement assay.
Top panel (A–F) shows performance of the most potent fragment hits in DSF, ITC, and ADPr-peptide displacement assay compared to ADP-ribose. C,D) Normalized raw DSF RFU demonstrates canonical unfolding curves and minimal compound-associated curve shape aberrations. Tma elevation reveals Mac1 stabilization through fragment binding. Gradient color scale: 0 mM = yellow; 3 mM = purple. E) Integrated heat peaks measured by ITC as a function of binding site saturation. The black line represents a non-linear least squares (NLLS) fit using a single-site binding model. F) Peptide displacement assay measures ADPr-peptide displacement (i.e. % competition) from Mac1 by ligand. G) Summary of solution binding data for fragments from top panel. ΔTma are given for the highest compound concentration in this assay. H) Additional fragment hits showing Mac1 peptide competition.

