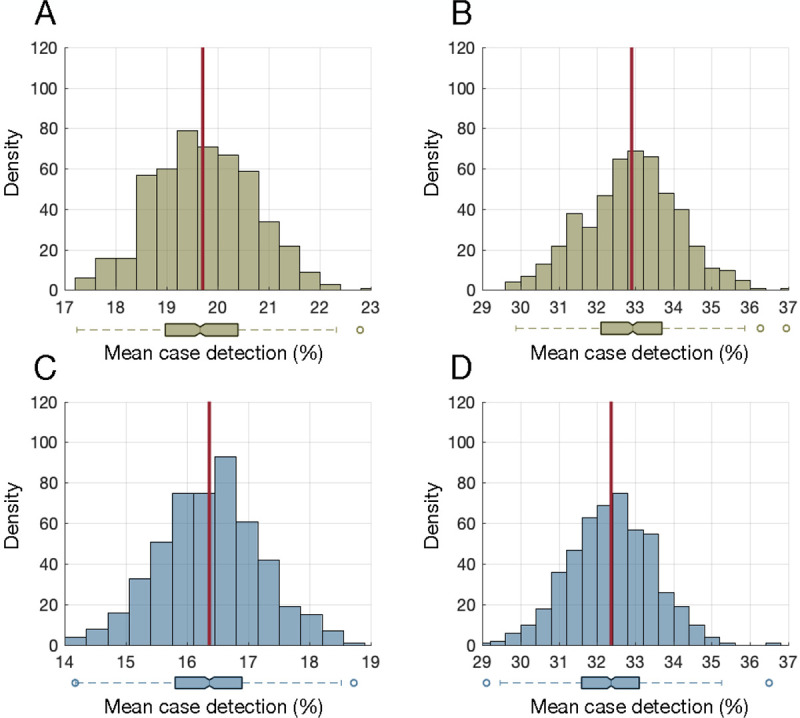
Figure 2.

Distribution of mean case detection percentages during the pre-symptomatic stage using bi-weekly nasopharyngeal (A) and saliva (C) testing. Distribution of mean case detection percentages during the pre-symptomatic stage using weekly nasopharyngeal (B) and saliva (D) testing. The red line indicates the mean of the distribution, and the boxplot represents the interquartile range (IQR) with whiskers extending the range from minimum (25th percentile – 1.5 IQR) to maximum (75th percentile + 1.5 IQR). The density on the y-axis is the number of experiments from 500 iterations (Monte-Carlo simulations) that resulted in a mean case detection shown on the x-axis.
