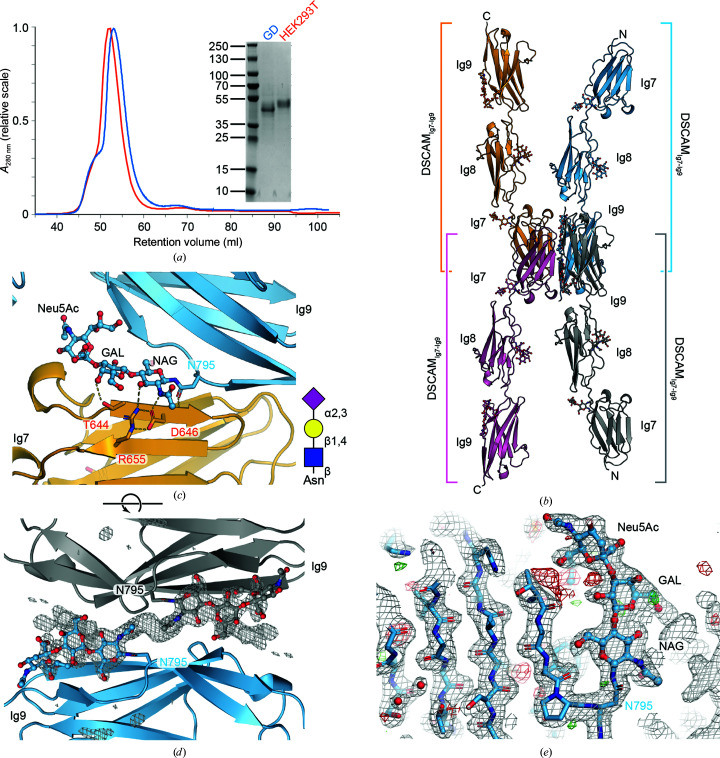
Figure 1.
Structural analysis of DSCAMIg7–Ig9 derived from HEK293 GD. (a) Comparison of HEK293T and HEK293 GD-derived DSCAMIg7–Ig9; the inset shows reduced SDS–PAGE analysis of the purified proteins. (b) Cartoon representation showing four copies of DSCAMIg7–Ig9 that form an oligomer by crystallographic symmetry around the glycan stub. The asymmetric unit contains a single copy. (c) Detailed view of the accommodation of the glycan stub at residue Asn795 in the Ig7–Ig9 interface. The inset shows a schematic representation of the glycan. (d) An OMIT map of the same glycan stub contoured at 3σ. (e) Representative electron density around the glycan at position Asn795. The 2mF o − DF c electron-density map is shown as a gray mesh (contoured at 1σ). Residual positive and negative mF o − DF c electron-density maps (contoured at ±3σ) are shown in green and red, respectively.

