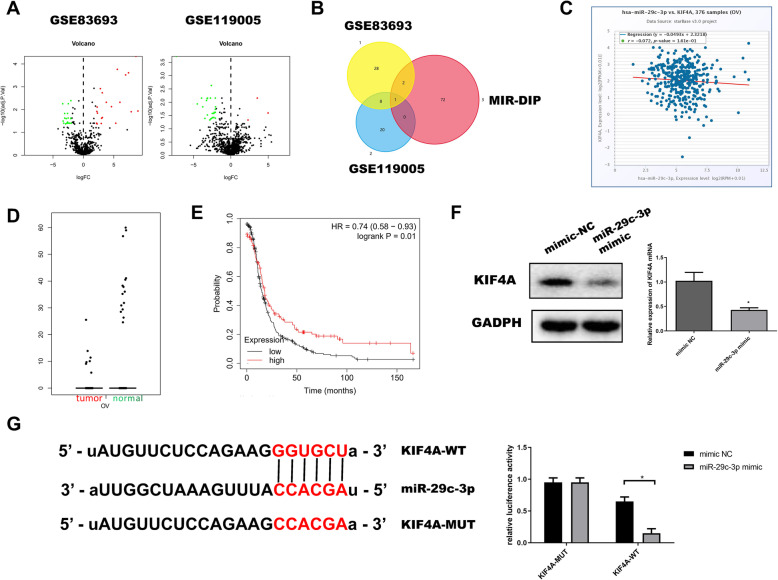
Fig. 3.
miR-29c-3p targeted downregulated KIF4A. a DEmiRNAs volcano map of normal and OC groups in GEO dataset. Red and green indicated upregulation gene and downregulation gene, respectively. b In the intersection, there was only one miRNA. Venn diagram showed a predicted DEmiRNA for KIF4A. c Pearson correlation analysis of KIF4A and miR-29c-3p. d Red and green indicated tumor samples and normal samples, respectively. e Survival curves of miR-29c-3p expression for prognosis. Red and black indicated high expression group and low expression group, respectively. f KIF4A mRNA and protein levels were detected by qRT-PCR and WB for evaluating effects of miR-29c-3p expression. g Binding sites of miR-29c-3p and 3′UTR of KIF4A. The targeted binding of miR-29c-3p and KIF4A was determined by dual-luciferase reporter gene assay

