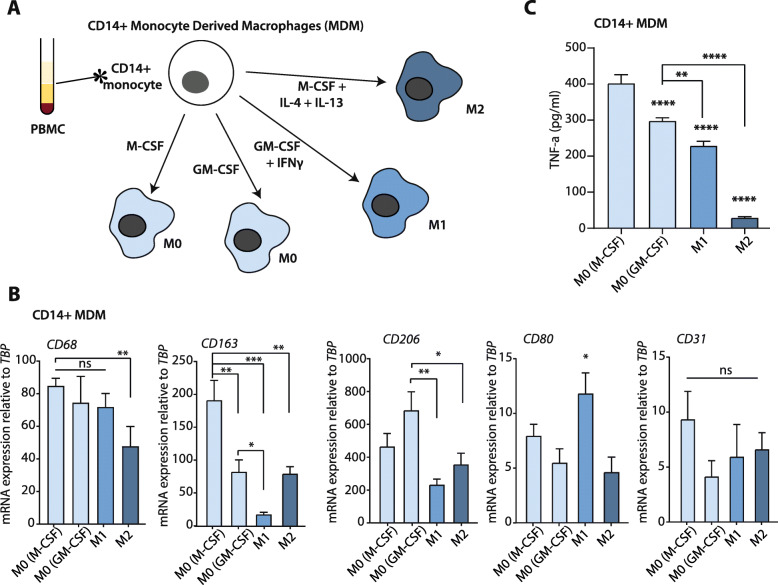
Fig. 4.
Isolation and TNF-α expression of CD14+ monocyte-derived macrophages (MDM). a Schematic representation of the macrophage differentiation procedure and the resulting macrophage subtypes. b Relative mRNA expression of CD68, CD163, CD206, CD80, and CD31 on the macrophage subtypes. On the figure shown is the mean ± SEM (n = 4); One-way ANOVA was used to assess statistical significance. Relative expression levels were calculated using the dCt method and normalized to the expression of the reference gene TBP. c TNF-α levels in conditioned media from all different macrophage subsets, measured by ELISA. On the figure, shown is the mean ± SEM (n = 4); One-way ANOVA was used to assess statistical significance

