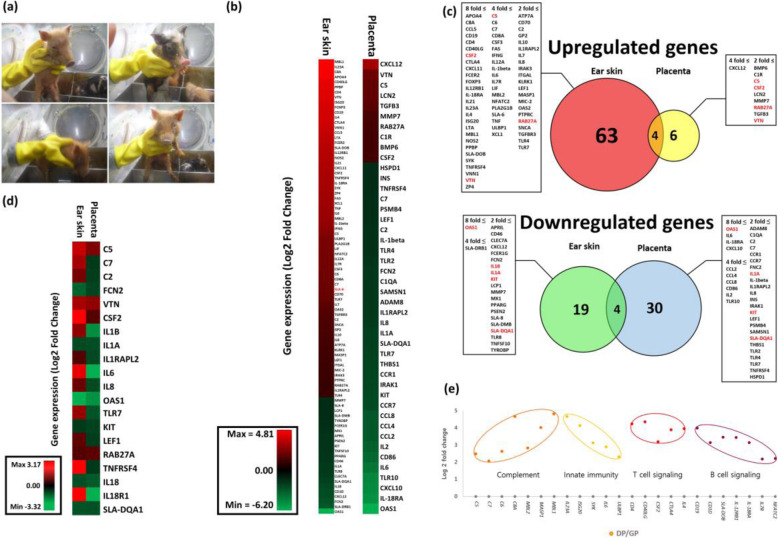
Fig. 1.
Immunological transcriptome profile of pigs. a Pictures of Germ-free piglets born in sterile isolator. b Heatmap for comparison of immune related genes in ear skin and placenta. Each fold change was calculated by comparing domestic pigs (DPs) with germ-free minipigs (GPs). c Venn Diagram showing up and down-regulation of immune-related genes in DPs compared to GPs. The number of genes and gene symbols are described in each circle and box. Genes having same expression pattern in both tissues are marked as red color. d Heatmap for comparing pattern of immune-related genes commonly expressed in both tissues. e Process of systemic immune activation of DPs. The same colored dots are grouped by same signaling pathway. The Y-axis indicates the log2 fold change of relative gene expression in DPs compared to GPs. The X-axis indicates gene symbol

