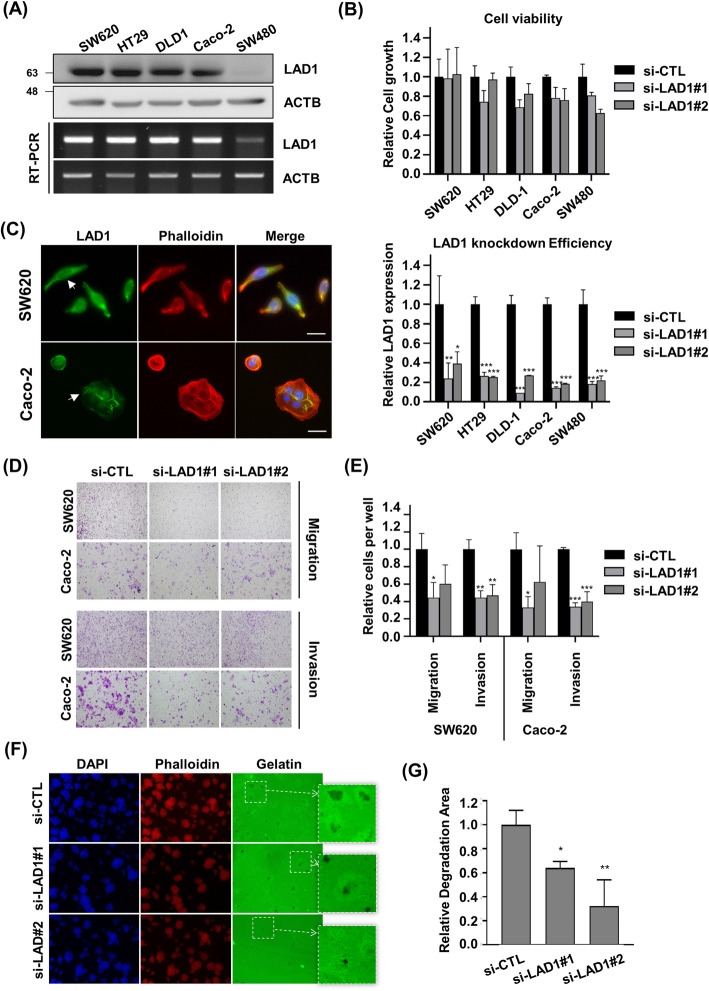
Fig. 2.
LAD1 is involved in the migration and invasion of colorectal cancer cells in vitro. a LAD1 was highly expressed in colorectal cancer cell lines. The expression of LAD1 in diverse human colorectal cancer cell lines was determined by immunoblots (IB) with anti-LAD1 antibody and RT-PCR. Shown are the cropped blot and gel images. b LAD1 depletion had little effect on the viability of colorectal cancer cells in vitro. The viability of colorectal cancer cells was examined with a Cell Titer-Blue Cell® viability assay. Relative cell growth was calculated by normalizing fluorescent signals in si-LAD1 with those in si-CTL (upper). The knockdown efficiency of LAD1 in human colorectal cancer cell lines was estimated by qRT-PCR (lower). Error bars represent the mean standard deviation (n = 3; *, p < 0.05, **, p < 0.01, ***, p < 0.001). c LAD1 was detected at cellular edges and partly with actin filaments in SW620 and Caco-2 cells. Localization of LAD1 and F-actin was visualized by immunofluorescence using anti-LAD1 antibody (green) and phalloidin (red). Scale bars denote 20 μm. Arrows indicate stress fiber-like structures stained by LAD1. d and e LAD1 knockdown inhibits the migration and invasion of SW620 and Caco-2 cells. SW620 and Caco-2 cells depleted of LAD1 with siRNAs were subjected to Transwell assays with or without Matrigel coating for migration or invasion measurements. Representative images of migrated and invaded cells are shown in (d). Relative cell numbers of migrated and invaded cells per well were normalized by the numbers of si-CTL-treated cells with those of si-LAD1-treated cells (e). Error bars represent the mean standard deviation (n = 3; *, p < 0.05, **, p < 0.01, ***, p < 0.001) (f and g) LAD1 depletion reduces the invadopodia-forming capability of SW620 cells. Degraded areas of fluorescently labeled gelatin matrix were visualized (f), and fluorescent-free areas were measured by ImageJ. Relative degradation area was calculated by normalizing fluorescent-free areas in si-LAD1 cells with those in si-CTL cells (g). Error bars represent the mean standard deviation (n = 3; *, p < 0.05, **, p < 0.01)

