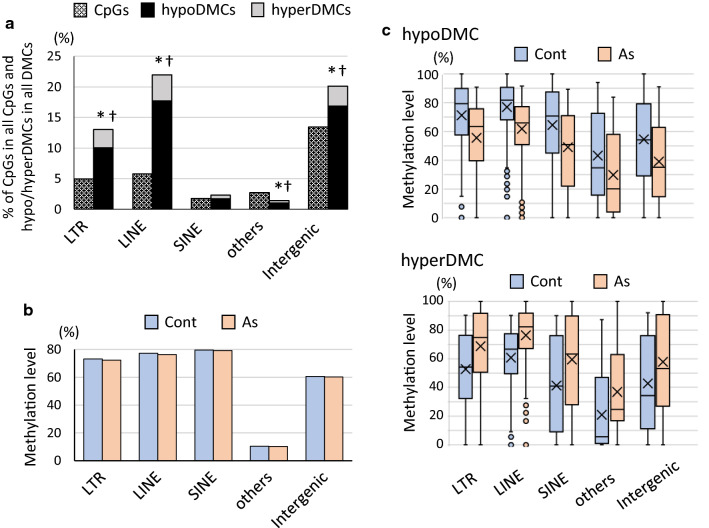
Fig. 3.
Detailed annotation of all CpGs and DMCs in the intergenic region and their methylation levels. a All CpGs (hatched bars) and DMCs including hypoDMCs (black bars) and hyperDMCs (gray bars) in the intergenic assignment shown in Fig. 2a were further annotated according to the detailed annotation of HOMER. Occurrence of DMCs (hypo and hyperDMCs) and hypoDMCs in each assignment was assessed using Fisher’s exact test and p < 0.001 was marked with * and †, respectively. b Average methylation levels of CpGs in each detailed annotation shown in a. c Box-and-whisker plots of methylation levels of hypo/hyperDMCs in each detailed annotation shown in a. Crosses and bars in the box represent average and median values, respectively, and dots indicate outliers

