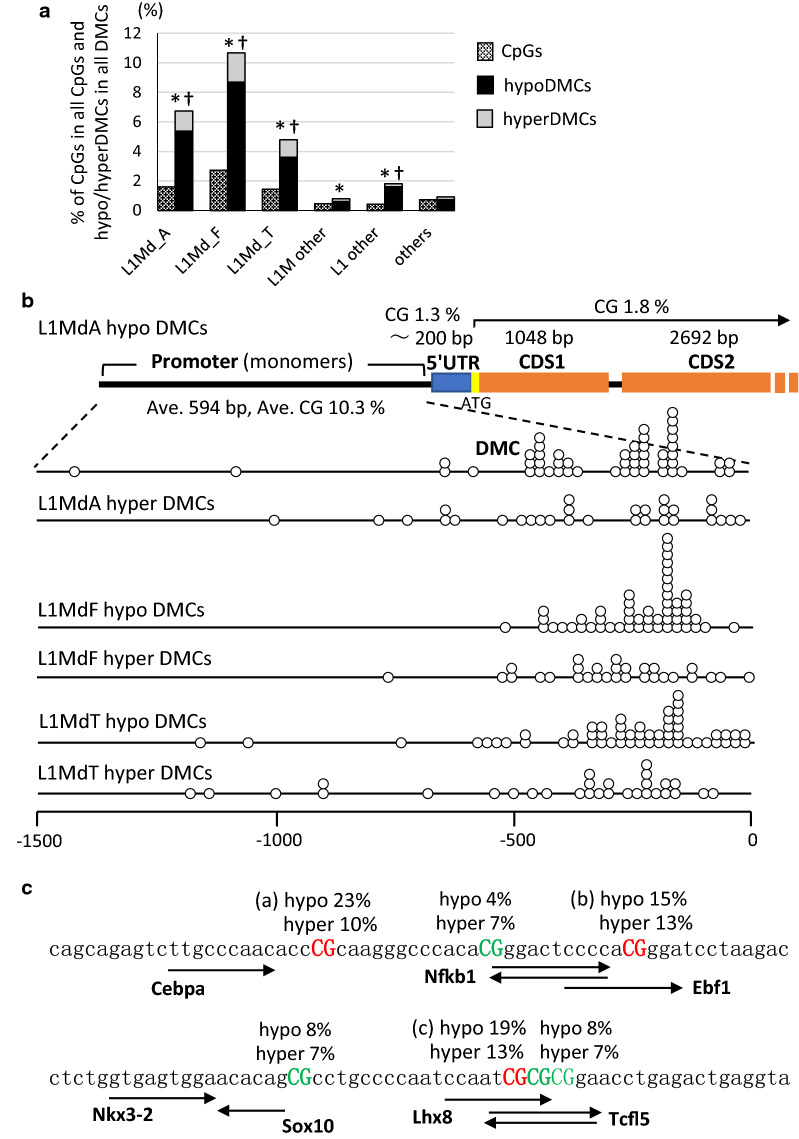
Fig. 4.
HypoDMCs were overrepresented in an active L1MdA subfamily in LINE. a All CpGs (hatched bars) and DMCs including hypoDMCs (black bars) and hyperDMCs (gray bars) in LINE in all the genomic region shown in Additional file 1: Fig. S2 were further classified according to the detailed annotation given by HOMER. Occurrence of DMCs (hypo and hyperDMCs) and hypoDMCs in each region was assessed using Fisher’s exact test and p < 0.001 was marked with * and †, respectively. b A schematic figure of L1MdA containing hypoDMCs and the positions of hypo/hyperDMCs (dots on the lines) in the promoter regions of full-length L1Md subfamilies. Fifty and 30 sequences were randomly selected from full-length L1MdA, L1MdF and L1MdT containing hypoDMCs and hyperDMCs, respectively, using SeqKit and the positions of DMCs were analyzed. The scheme at the top shows the average lengths of individual domains and % CpGs in the domains in L1MdAs containing hypoDMCs. c Transcription factor binding sites in a consensus sequence of L1MdA including hypoDMCs. Highly consistent sequences around the DMC hot spots (a–c in the figure) were extracted among 50 L1MdAs containing hypoDMCs. Percentages in 50 hypoDMCs and 30 hyperDMCs appearing in the individual CpGs were indicated in the figure

