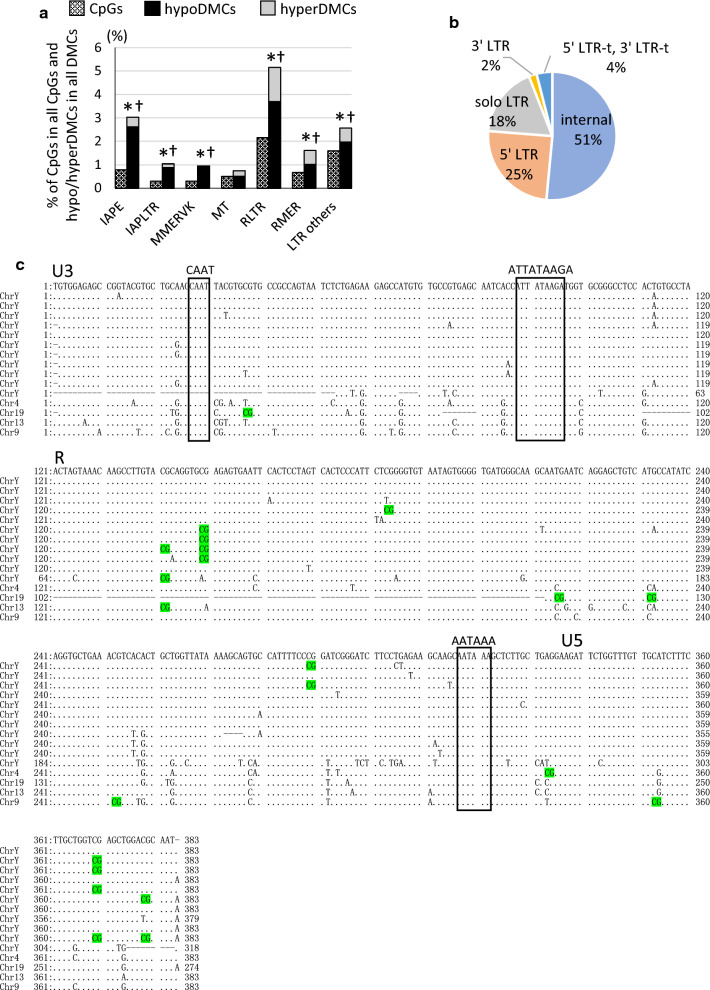
Fig. 5.
HypoDMCs were overrepresented in an active IAPE subfamily in LTR. a All CpGs (hatched bars) and DMCs including hypoDMCs (black bars) and hyperDMCs (gray bars) in LTR in all the genomic regions shown in Additional file 1: Fig. S2 were further classified according to the detailed annotation given by HOMER. Occurrence of DMCs (hypo and hyperDMCs) and hypoDMCs in each region was assessed using Fisher’s exact test and p < 0.001 was marked with * and †, respectively. b The proportion of IAPE hypoDMC fragments in all IAPE hypoDMCs. c The positions of hypoDMCs in the IAPE 5′LTRs. The position of hypoDMCs (colored in green) are shown in 5′LTR sequences containing transcription regulation sequences CAAT and TATA box and polyadenylation site (AATAAA). Dots (.) represents identical base and dashes (–) represents deletion

