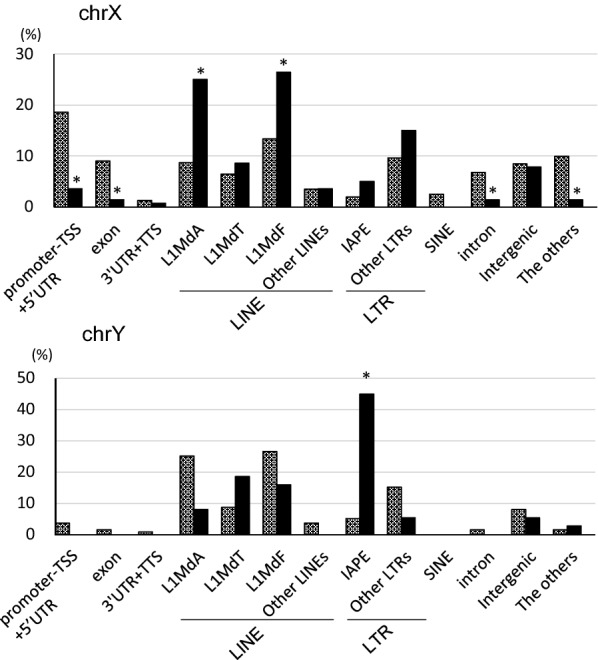
Fig. 6.

ChrX and ChrY were enriched with IAPE hypoDMCs and with L1MdA and L1MdF hypoDMCs, respectively. All CpGs and hypoDMCs in chrY and chrX in all the genic region were annotated according to the detailed annotation of HOMER. The detailed annotations were grouped as shown in Additional file 1: Table S1B. Percentage among CpGs (hatched bars) and hypoDMCs (black bars) were shown for chrX and chrY, respectively. # promoter indicates promoter-TSS and 5′UTR. Occurrence of hypoDMCs in each region was assessed using Fisher’s exact test and p < 0.01 was marked with *
