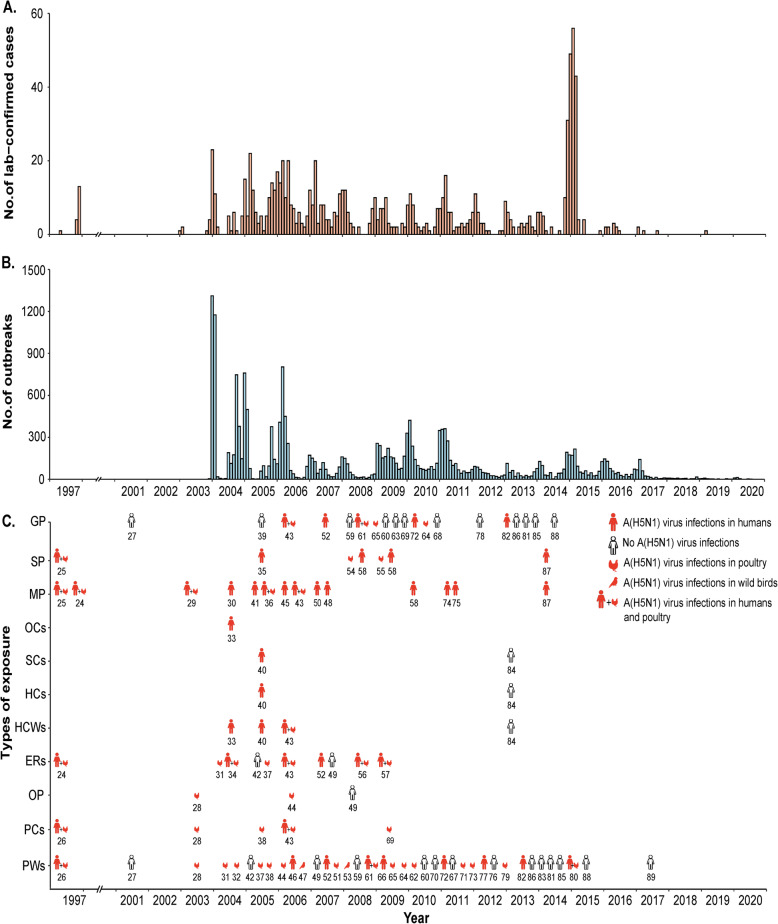
Fig. 2.
Epidemic curves of highly pathogenic avian influenza A(H5N1) virus infections in humans and animal reservoirs by country and temporal distribution of sixty-six A(H5N1) serosurveys in human by type of exposure, 1997–2020. a Epidemic curve of lab-confirmed human infections with highly pathogenic avian influenza A(H5N1) viruses. b Epidemic curve of lab-confirmed A(H5N1) outbreaks in poultry and wild birds. c Temporal distribution of the implementation of sixty-six A(H5N1) serological studies in poultry workers (PW), poultry cullers (PC), other occupationally exposed populations (OP), poultry-exposed residents (ER), exposed healthcare workers (HCW), household contacts (HC), social contacts (SC), other close contacts (OC), persons with both poultry and human exposures (MP), suspected mixed exposure population (SP), and general population (GP). In panel c, the color represents whether A(H5N1) virus infection occurred in humans, poultry, or wild birds occurred (red) or not (white) before or during the implementation of each study. The number below each symbol is the study reference number. The symbols in red color refer to A(H5N1) outbreaks that occurred in one of three species (i.e., humans, domestic poultry, or wild birds), while the human+chicken symbols together refer to A(H5N1) outbreaks that occurred in both humans and domestic poultry. Note that three multi-year cohort studies were classified as independent studies in panel c

