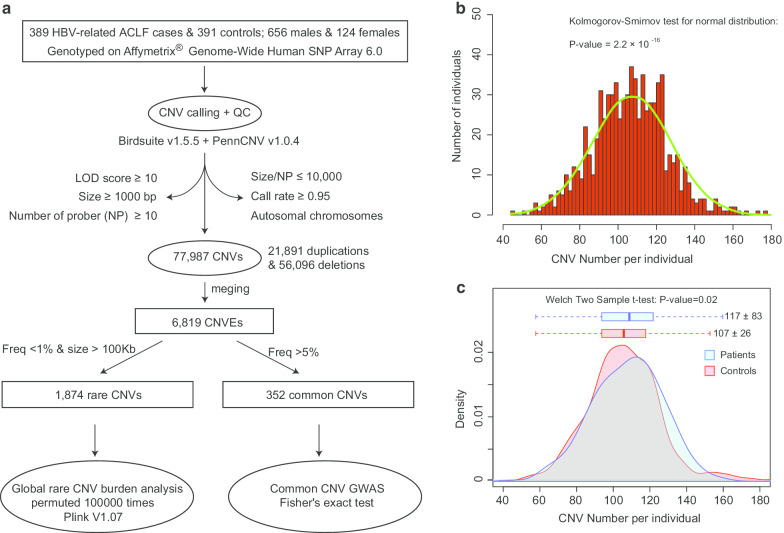
Fig. 1.
Overall analysis methods and genotyping results. a Overall flow chart of genotyping and analysis. Some intermediate results and final results were marked in the figure. The normal distribution test was applied to verify the randomness of the results (b), and the distribution of the CNV number of each individual was very close to normal (P = 2.2 × 10⁻¹⁶). However, the distribution showed significant difference between HBV-related ACLF cases and AsC controls (c), indicating the potential host CNVs difference of the HBV-related ACLF

