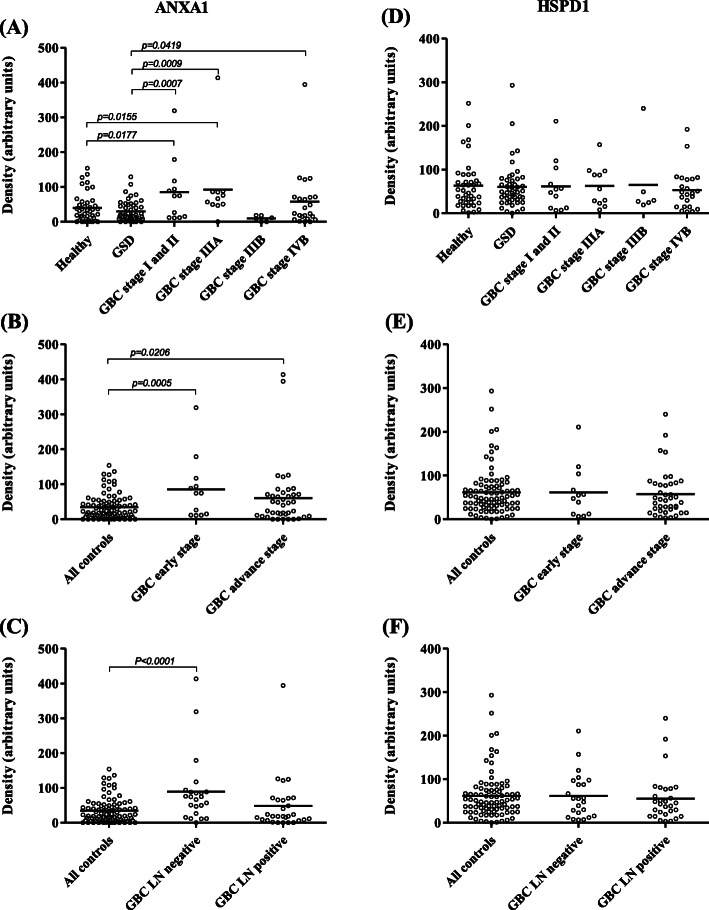
Fig. 3.
Clinical verification of ANXA1 and HSPD1 by Dot blot assay. Scatter plot showing relative levels of autoantibodies in controls (Healthy individuals, n = 34; GSD, n = 48) and cases (GBC stage I and II, n = 12; GBC Stage IIIA (n = 11); GBC Stage IIIB (n = 6); GBC stage IVB, n = 23). (a) The analysis showed a significant difference (p value ≤0.05) in autoantibody levels for ANXA1 in GBC stage I and II or IIIA (b) early stage GBC cases and (c) lymph node negative GBC cases (c) in comparison to both the controls. No significant difference in autoantibody levels for HSPD1 was observed in any of the GBC stages (d), early or advanced stage GBC cases (e) and lymph node negative or positive cases (f) in comparison to controls

