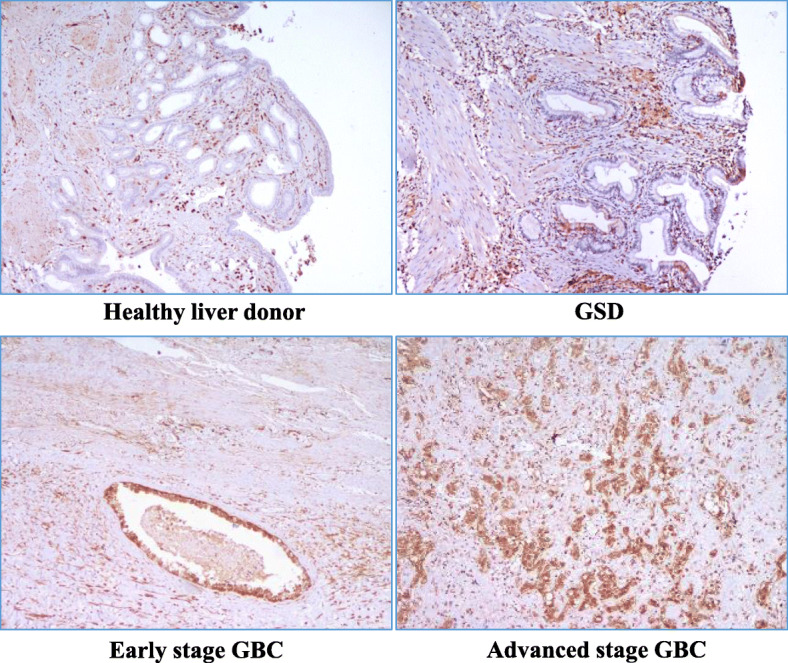
Fig. 5.

Representative IHC images showing expression of ANXA1 in controls and cases. IHC analysis performed using FFPE tissue from 14 controls (2 Healthy liver donors and 12 GSD cases) and 43 GBC cases (16 early stage and 27 advanced stage GBC cases) showed ‘high’ expression levels in 72% of GBC cases. ANXA1 expression was ‘high’ in 77.7% of advanced stage and 62.5% of early stage GBC cases whereas all the controls showed ‘low’ expression levels. The details of tissue microarrays and individual tissue sections used and IHC procedure is described in the Methods and IHC scoring criteria are shown in Supplementary Table S4
