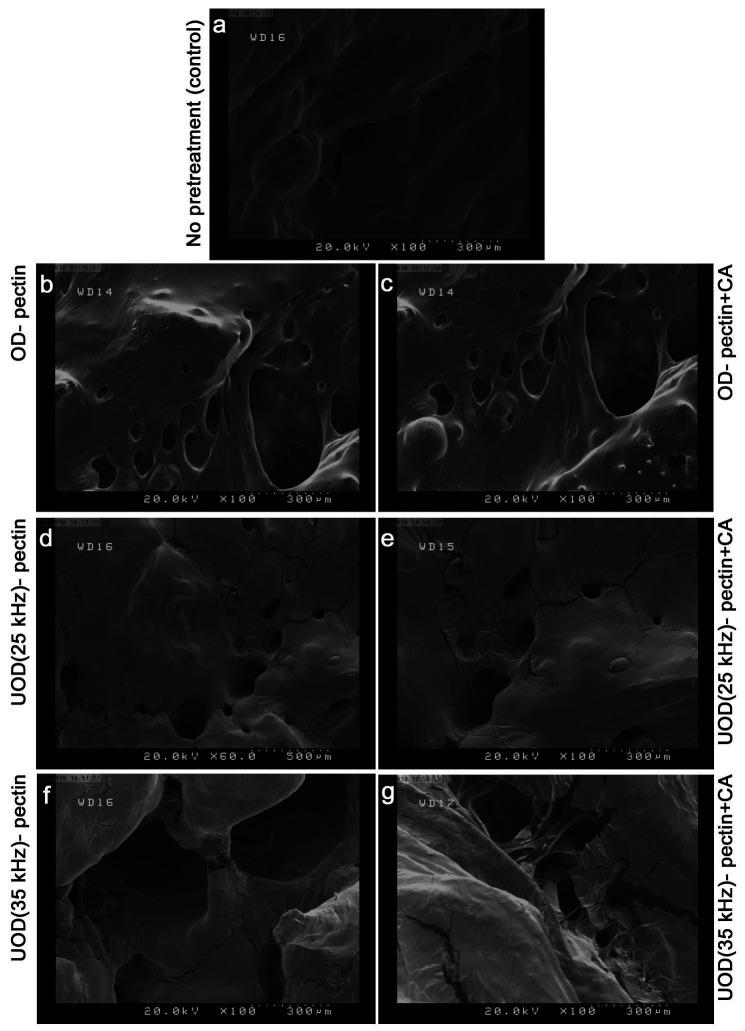
Fig. 4.
Scanning electron microscopy (SEM) images of: a) control, OD-treated and coated with: b) pectin, c) pectin and citric acid, UOD-treated at 25 kHz and coated with: d) pectin, e) pectin and citric acid, UOD-treated at 35 kHz and coated with: f) pectin, g) pectin and citric acid. OD=osmotic dehydration, UOD=ultrasound-assisted osmotic dehydration

