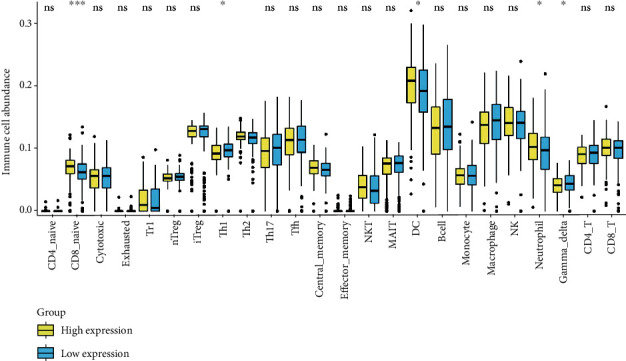
Figure 4.

Immune cell abundance analysis between the low-GJA1-expression group and the high-GJA1-expression group. ∗p < 0.05, ∗∗p < 0.01, and ∗∗∗p < 0.001.

Immune cell abundance analysis between the low-GJA1-expression group and the high-GJA1-expression group. ∗p < 0.05, ∗∗p < 0.01, and ∗∗∗p < 0.001.