
Figure 4.
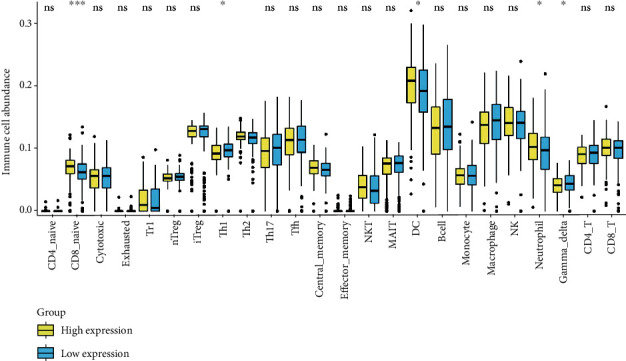
Immune cell abundance analysis between the low-GJA1-expression group and the high-GJA1-expression group. ∗p < 0.05, ∗∗p < 0.01, and ∗∗∗p < 0.001.
Official websites use .gov
A
.gov website belongs to an official
government organization in the United States.
Secure .gov websites use HTTPS
A lock (
) or https:// means you've safely
connected to the .gov website. Share sensitive
information only on official, secure websites.
Immune cell abundance analysis between the low-GJA1-expression group and the high-GJA1-expression group. ∗p < 0.05, ∗∗p < 0.01, and ∗∗∗p < 0.001.