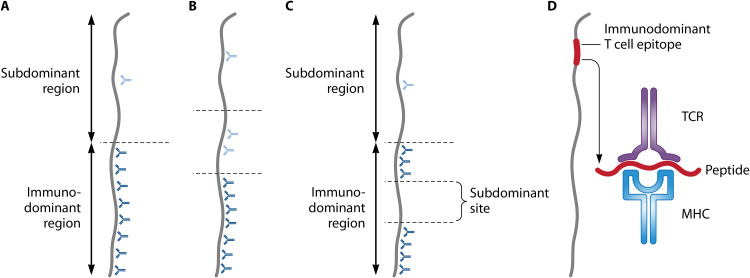
FIG 1.
Fundamentals of immunodominance and subdominance in antibody responses. Panels A to C refer to antibody responses, and for comparison, panel D shows immunodominance in T cell responses. The antigen shown here is a protein, and for simplicity, it is represented schematically as a rod. However, it should be noted that most epitopes recognized by an antibody are conformational. Note that antibody immunodominance is a quantitative concept, not a qualitative one. (A) In the simplest case, one region of a protein is immunodominant, implying that it elicits the quantitatively dominating antibody response, while another region is subdominant. Antibodies are represented by Y-forms, with those directed against subdominant and immunodominant regions shown in light blue and dark blue, respectively. (B) In some cases, a hierarchy of immunodominance may be discerned among different parts of a protein. (C) An immunodominant region may include a subdominant site, a situation that has attracted particular interest in viruses. (D) Immunodominance in T cell responses. In the adaptive immune response to a protein, major histocompatibility complex (MHC) molecules form complexes with peptides derived from the protein, and these complexes are presented for recognition by T cell receptors (TCRs). However, peptides that are efficiently presented for recognition represent only a small minority of all peptides that potentially can be derived from the protein. These rare peptides correspond to T cell epitopes that are immunodominant in the responding individual (28, 234). In the figure, the peptide is enlarged compared to the epitope.

