Figure 1.
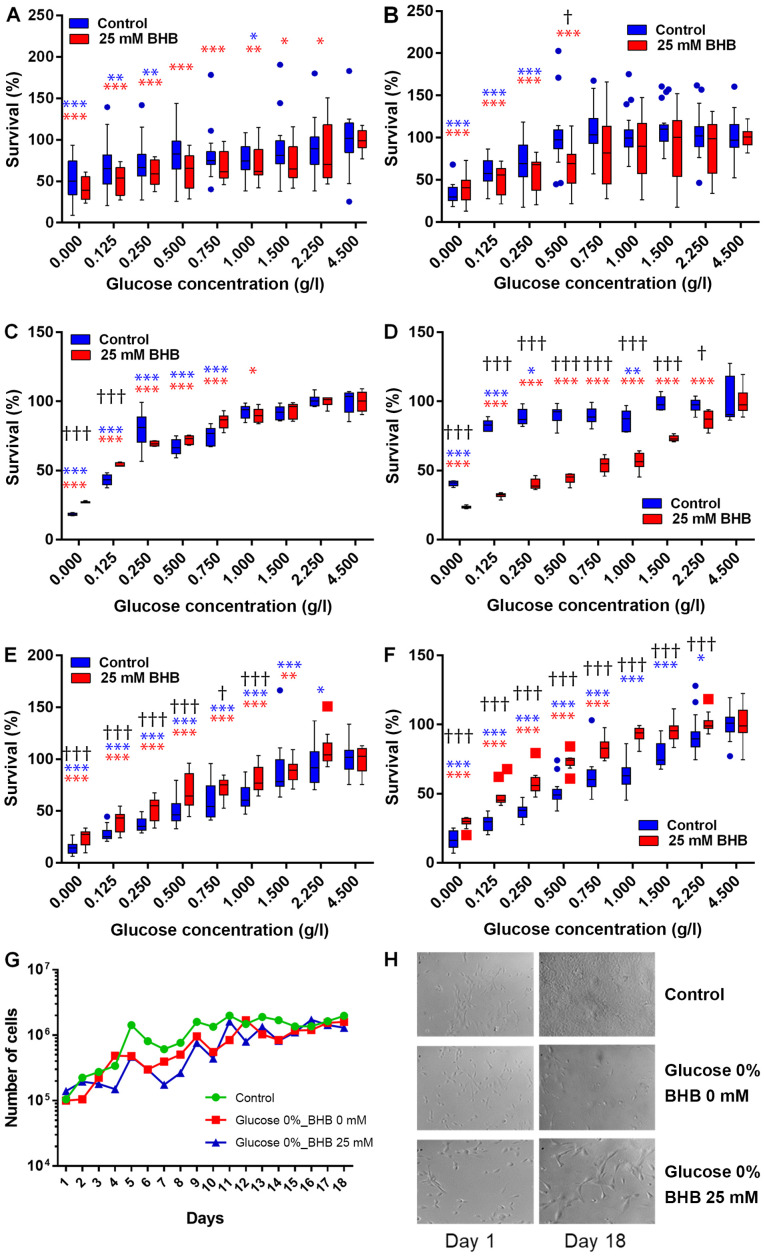
Cell proliferation analysis in glucose starved human cells. (A and B) MCF-7, (C and D) T47D human breast cancer cells and (E and F) MCF-10A human breast epithelial cells were incubated in decreasing amounts of glucose alone (blue) or in the presence of 25 mM BHB (red) for (A, C and E) 48 h or (B, D and F) 72 h. Bars represent interquartile range including the observed median (horizontal line). Whiskers represent highest and lowest observed values. Outliers detected by the Tukey-method are indicated by blue circles and red squares for not-BHB- and BHB-supplemented cells, respectively. *Indicate significant difference of the respective treatment [not-BHB supplemented (blue); BHB supplemented (red)] between the glucose concentration it is associated with and the respective cell proliferation level observed at 4.5 g/l glucose as calculated by two-way ANOVA followed by Holm-Sidak post hoc corrections for multiple comparisons. †Indicate significant difference between not-BHB- and BHB-supplemented cells at the specific glucose concentration as calculated by multiple t-tests with Holm-Sidak method corrections. Significant levels: */†P<0.05; **P<0.01; ***/†††P<0.001. (G) MCF-7 breast cancer cells were incubated in regular high-glucose DMEM medium (green), in glucose depleted DMEM medium (red) or in glucose depleted medium supplemented with 25 mM BHB (blue) for up to 18 days. Line graphs represent mean cell count of two independent experiments. Error bars for standard deviation were omitted for clarity. There were no significant differences in proliferation at any time-point. (H) Brightfield pictures at ×40 magnification of MCF-10A human breast epithelial cells after 18 days of exposure to glucose deprivation with or without BHB supplementation. BHB, β-hydroxybutyrate.

